Is there a statistical method to identify the type of outliers shown in the pictures attached to my question?
+4
−0
I have obtained experimental data:
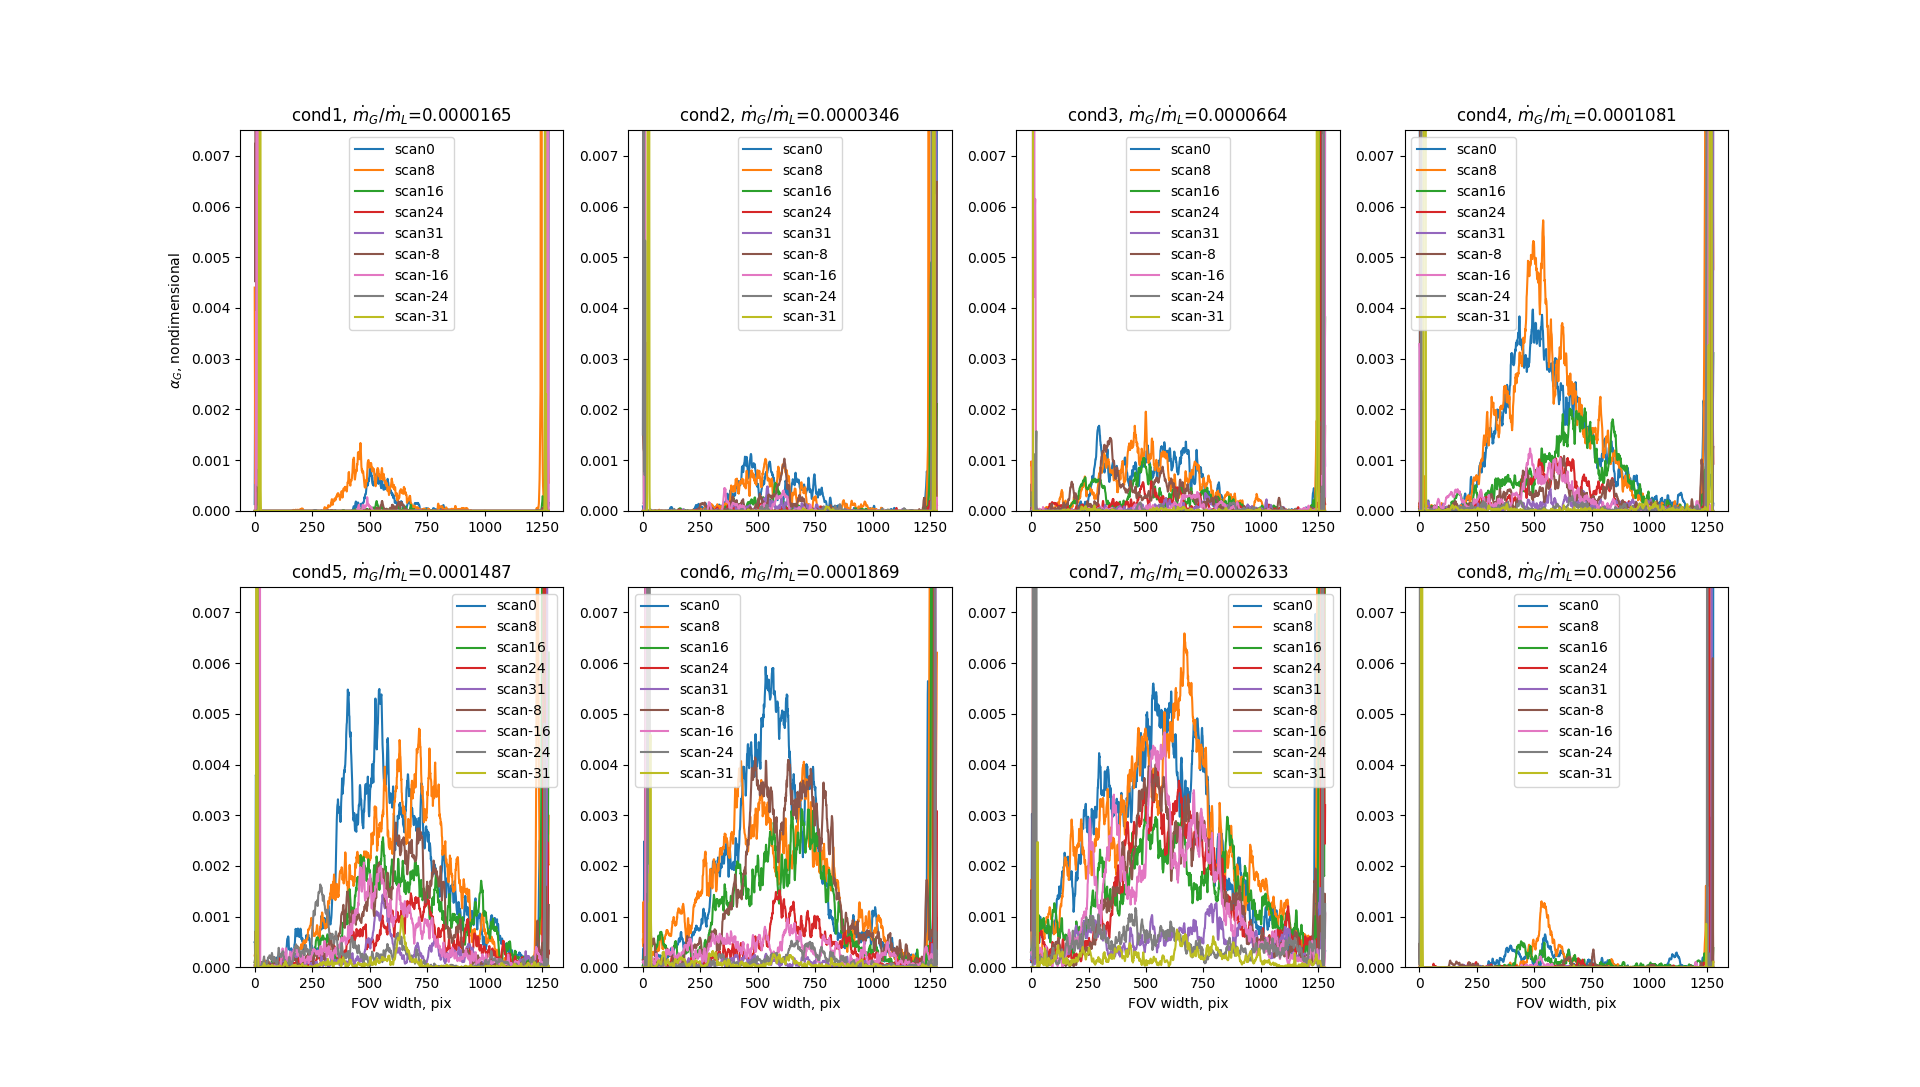
Those "horns" (leftmost and rightmost peaks) in each image are outliers.
Is there a statistical method that can identify those "horns" as outliers?
Possibly useful clarifications.
- The data is the distribution of white pixels along the horizontal axes of binarized images. Since I did the experiments I do know that those "horns" are outliers.
- I would like to automate outliers identification and removal because I will have way more data like this.
- The immediate left and right vicinity of each horn contains "good" data points (i.e. not "outlying" data points). Thus, I was hoping to identify the outliers and substitute them with interpolated values.
- From what I could find, the general consensus is that there are 5 ways to identify outliers: visually inspect the numerical values of the data, visually inspect the graphed data, Z-score, IQR, hypothesis tests.
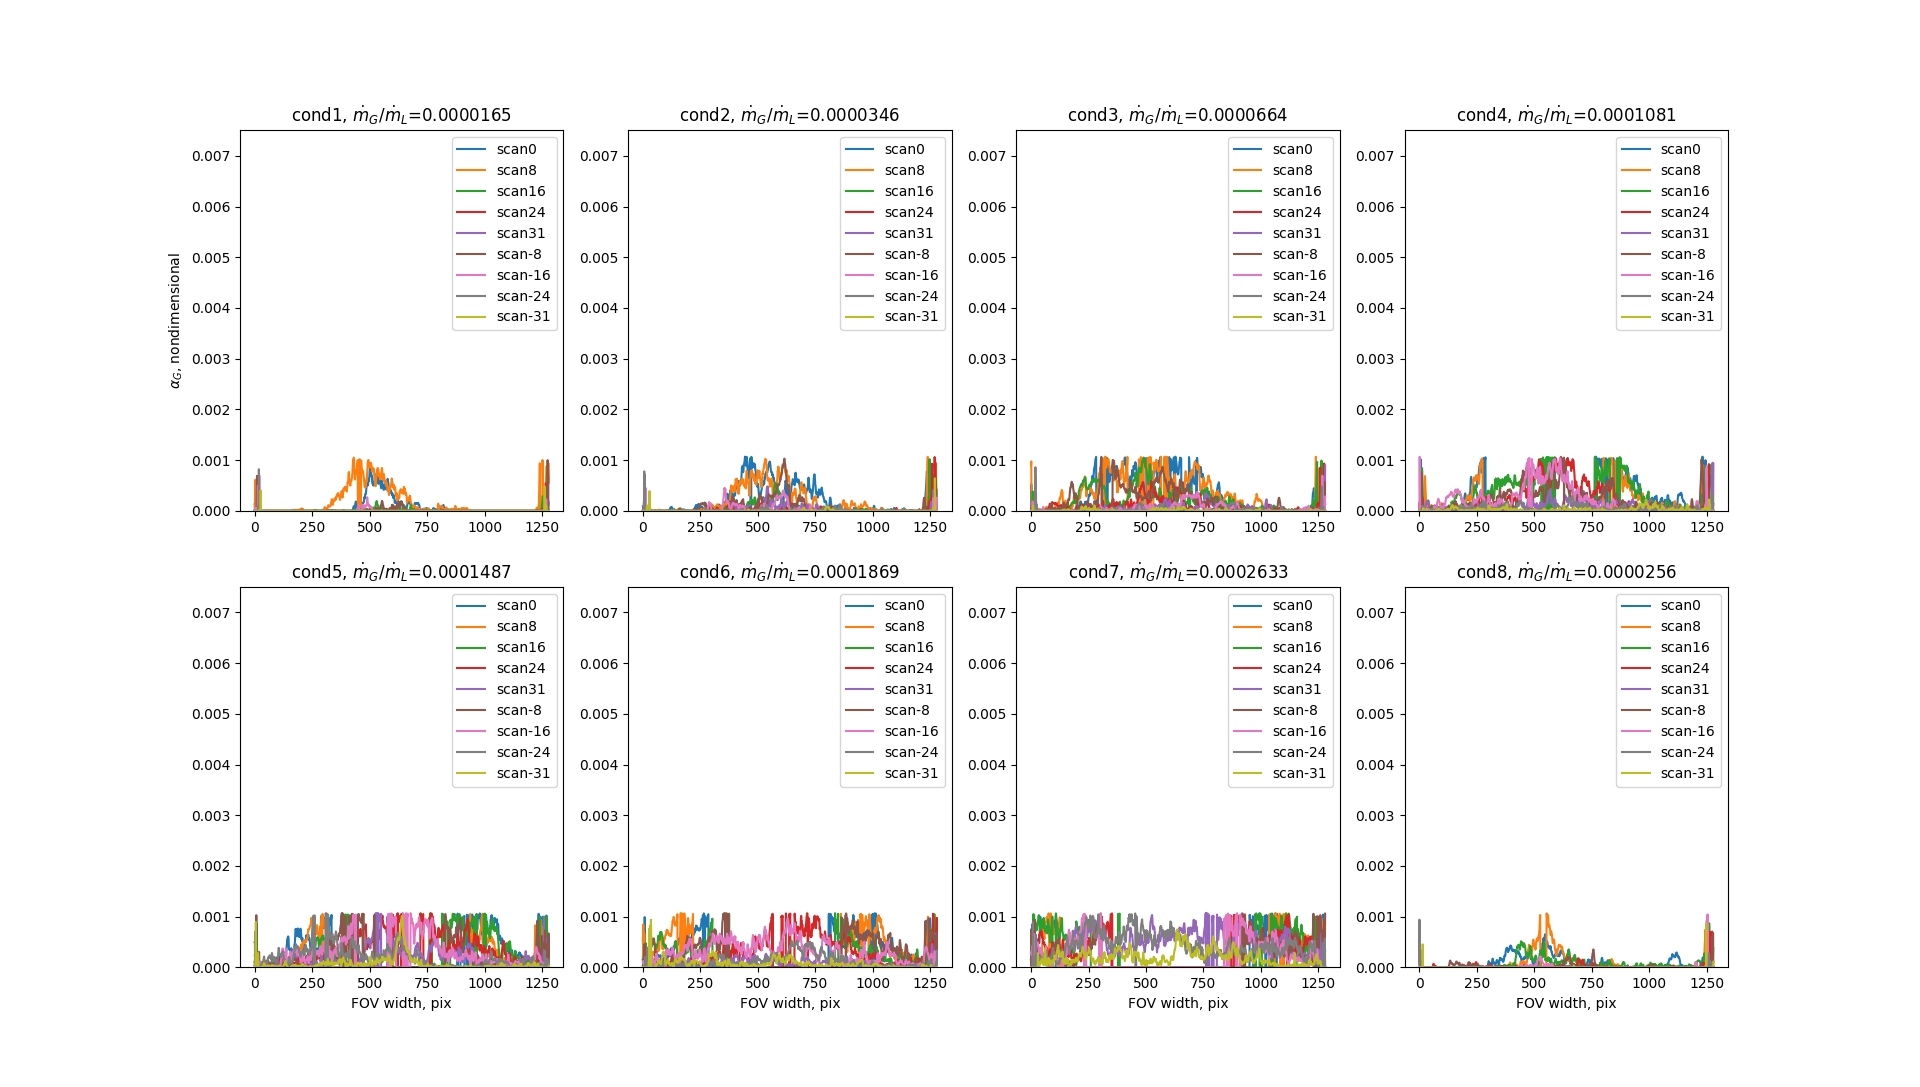
I have, obviously, tried visual inspection. That ensues "cutting off" the horns. Which I can do, but I want to exhaust other means first. Hypothesis tests are highly dependent on hypothesis, which in my case is almost impossible to make (if I say there is one outlier and iterate, then how do I know when to stop iterating). IQR is deemed superior to Z-score. So, I tried IQR at once: it just "capped" all the data:
- I was thinking about implementing IQR in a moving window, but before messing with that (and with other ideas of mine, like FFT or curve fitting) I would like to know is there a nice method that could identify those "horns" as outliers.
- I used
matplotlib'splotfunction to obtain the plots. I.e., it connected my data points with straight lines. Perhaps, I should've usedscatterfunction. The bottom line is treat my plots as discrete data points, not as continuous lines.
1 answer


0 comment threads