Communities

Writing
Writing
Codidact Meta
Codidact Meta
The Great Outdoors
The Great Outdoors
Photography & Video
Photography & Video
Scientific Speculation
Cooking
Cooking
Electrical Engineering
Judaism
Judaism
Languages & Linguistics
Software Development
Mathematics
Mathematics
Christianity
Christianity
Code Golf
Code Golf
Music
Music
Physics
Physics
Linux Systems
Linux Systems
Power Users
Power Users
Tabletop RPGs
Tabletop RPGs
Community Proposals
Community Proposals
tag:snake search within a tag
answers:0 unanswered questions
user:xxxx search by author id
score:0.5 posts with 0.5+ score
"snake oil" exact phrase
votes:4 posts with 4+ votes
created:<1w created < 1 week ago
post_type:xxxx type of post
Search help
Notifications
Mark all as read See all your notifications »
Q&A

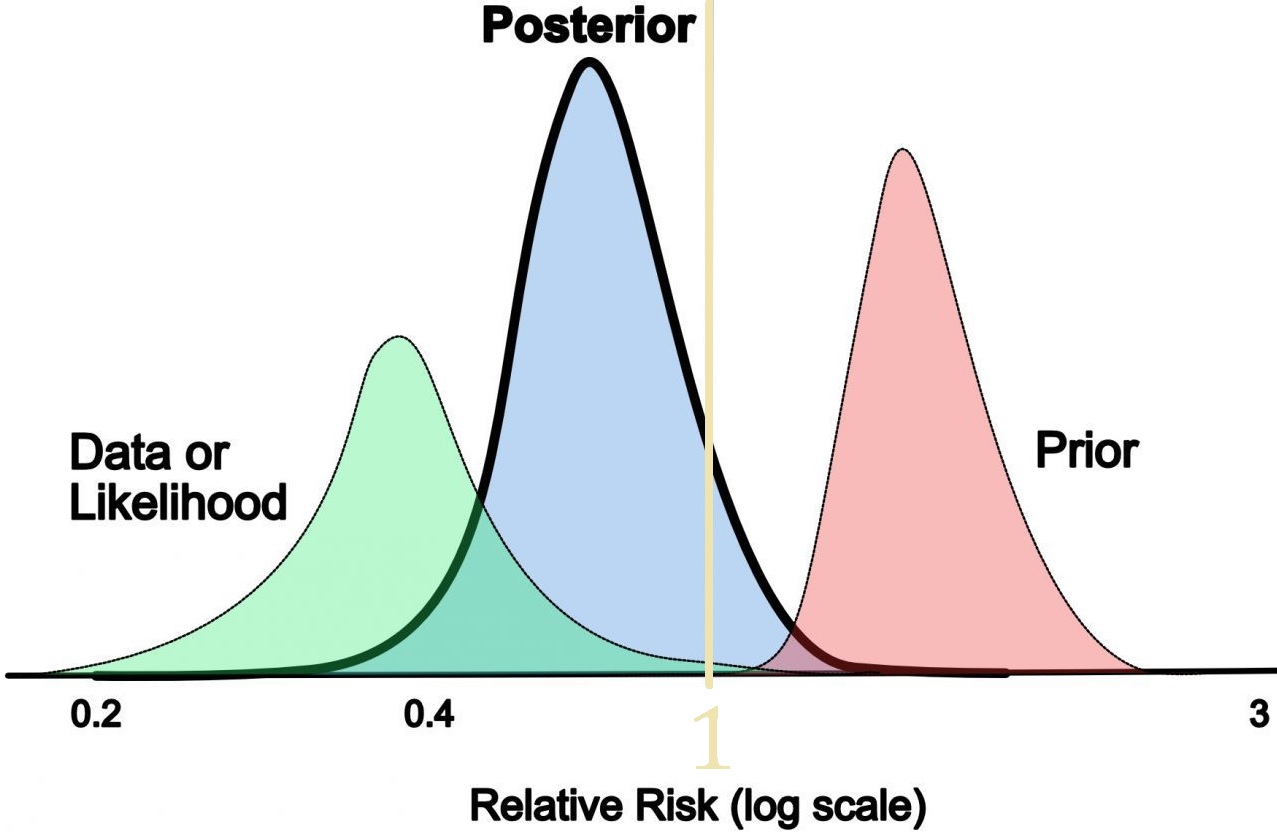
How do these 3 bell curves of Likelihood, Posterior, Prior pictorialize the Odds form of Bayes' rule?

+0
−3

I learn best visually, and I found these graph. 1. Does it furnish intuition on Theorem 2.3.5 below?

  1. E.g. Is the Likelihood Ratio always graphically left of Posterior and Prior? If so, why?

This can also be pictorially represented – the graph below shows the new posterior belief for a certain treatment has a reduced relative risk when the prior belief is combined with the data collected.

Image alt text

Image alt text

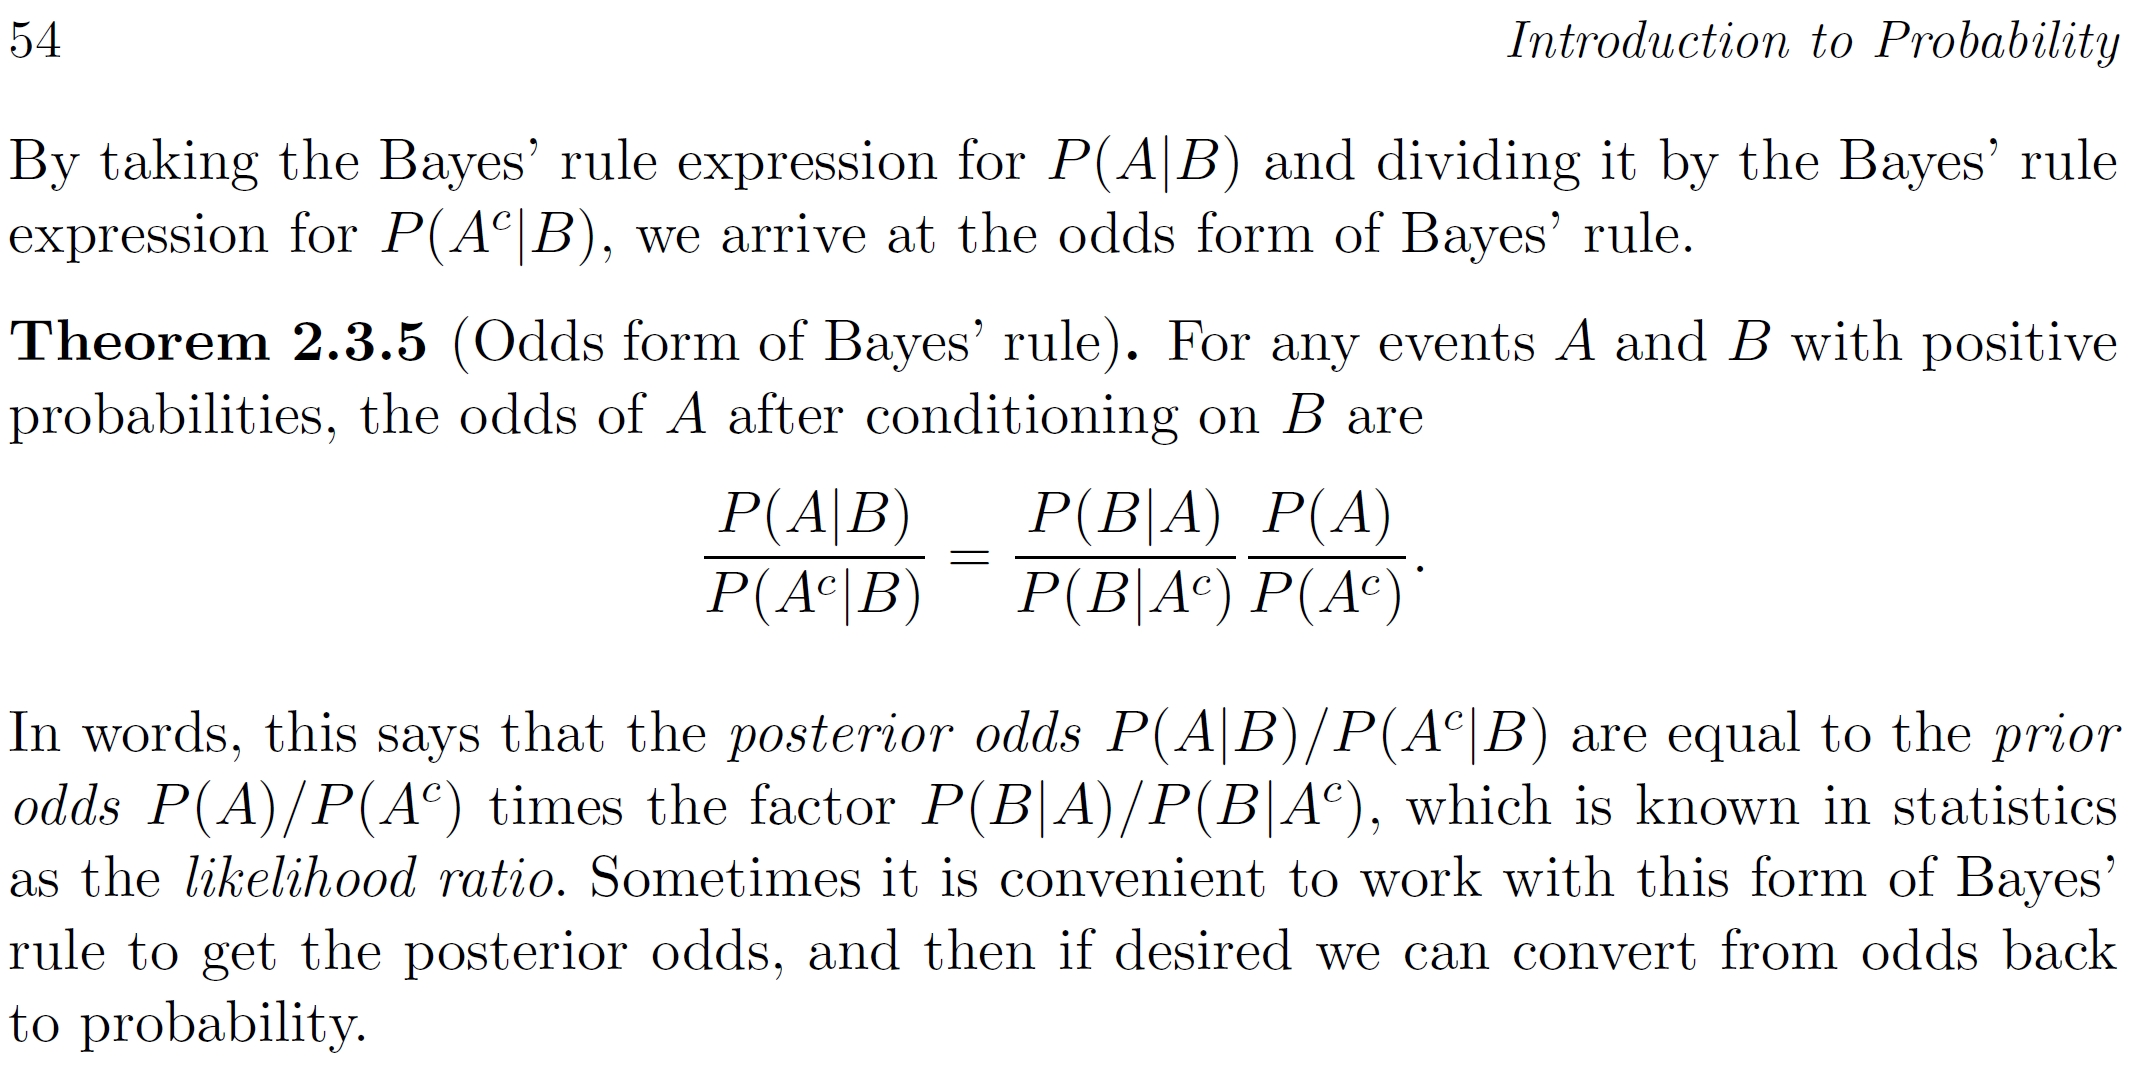
Blitzstein. Introduction to Probability (2019 2 ed). p 53.

Here are more details and better pictures of Theorem 2.3.5.

History
Why does this post require moderator attention?
You might want to add some details to your flag.
Why should this post be closed?

1 comment thread

Advice to post text and Mathjax and not images. (1 comment)

0 answers

Sign up to answer this question »