Post History
#2: Post edited
by
 TheCodidacter, or rather ACodidacter
·
2023-09-27T16:04:36Z (over 1 year ago)
TheCodidacter, or rather ACodidacter
·
2023-09-27T16:04:36Z (over 1 year ago)
Clearer wording
- So, a friend asked me **the probability for a candidate to get at least 50% of the total votes** in an election consisting of 5 candidates (let's pretend everyone picks at random 🙂). I thought for a bit and then presented an answer:
- > Let's first generalize so that the election has $n$ candidates.
- >
> We can think of this as a pie chart with $n$ slices and $n$ borders. We draw one fixed border from the center to the top, and then draw $n-1$ more.- > 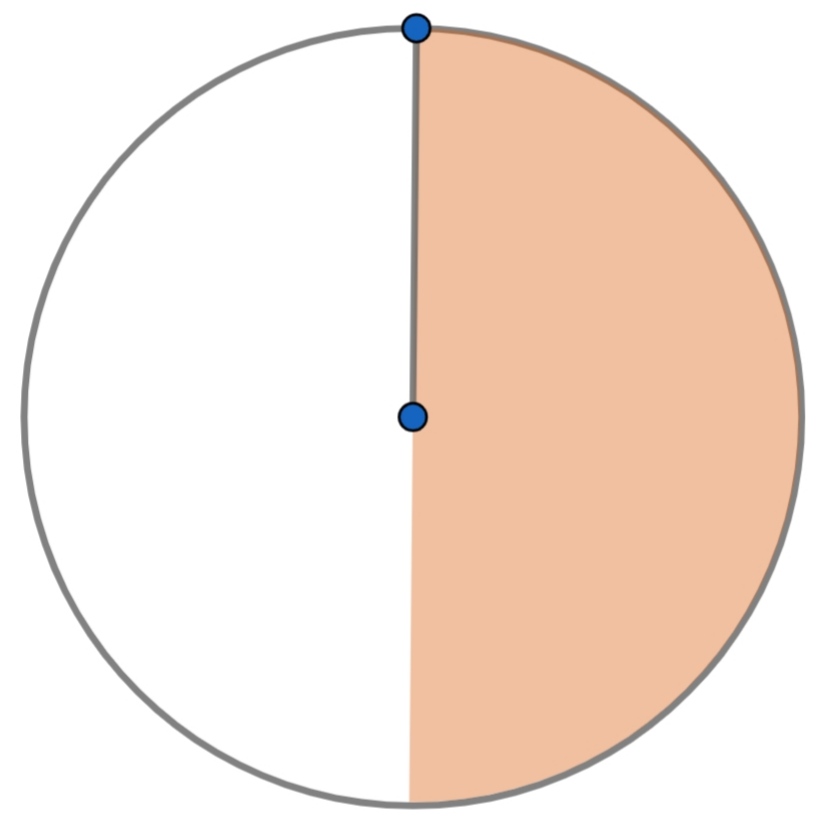
- > Now, the probability of the first candidate getting $\geq50\%$ of all votes (shaded area) is equivalent to the probability of all $n-1$ lines being on the unshaded side of the disk, which is $\left(\frac12\right)^{n-1}$.
- >
- > Since this probability should be the same for every candidate, the overall probability of someone getting at least half of all votes cast is $n\cdot\left(\frac12\right)^{n-1}=\frac n{2^{n-1}}$.
- I found with some coding that for my pie chart analogy of the problem, this is indeed correct (yeay!).
- However, for the original problem... **I was absolutely wrong!** With some coding (again), I found out that the actual probability is very close to, if not $\frac1{(n-1)!}=\frac n{n!}$.
- Why's that? I'm certain it's because the two behave differently, but if that's so I don't get why they do.
- **What causes this behavior? Has this problem been studied before, and is this perhaps a branch of probability theory?**
- Thanks in advance!
- So, a friend asked me **the probability for a candidate to get at least 50% of the total votes** in an election consisting of 5 candidates (let's pretend everyone picks at random 🙂). I thought for a bit and then presented an answer:
- > Let's first generalize so that the election has $n$ candidates.
- >
- > We can think of the votes cast between candidates as a pie chart with $n$ slices and $n$ borders. We draw one fixed border from the center to the top, and then draw $n-1$ more with randomized positions in the chart. Furthermore, let's say the chart shows the votes acquired by candidate 1, candidate 2, etc from the top going clockwise.
- > 
- > Now, the probability of the first candidate getting $\geq50\%$ of all votes (shaded area) is equivalent to the probability of all $n-1$ lines being on the unshaded side of the disk, which is $\left(\frac12\right)^{n-1}$.
- >
- > Since this probability should be the same for every candidate, the overall probability of someone getting at least half of all votes cast is $n\cdot\left(\frac12\right)^{n-1}=\frac n{2^{n-1}}$.
- I found with some coding that for my pie chart analogy of the problem, this is indeed correct (yeay!).
- However, for the original problem... **I was absolutely wrong!** With some coding (again), I found out that the actual probability is very close to, if not $\frac1{(n-1)!}=\frac n{n!}$.
- Why's that? I'm certain it's because the two behave differently, but if that's so I don't get why they do.
- **What causes this behavior? Has this problem been studied before, and is this perhaps a branch of probability theory?**
- Thanks in advance!
#1: Initial revision
by
TheCodidacter, or rather ACodidacter
·
2023-09-27T15:01:14Z (over 1 year ago)
Strange behavior in elections and pie charts
So, a friend asked me **the probability for a candidate to get at least 50% of the total votes** in an election consisting of 5 candidates (let's pretend everyone picks at random 🙂). I thought for a bit and then presented an answer:
> Let's first generalize so that the election has $n$ candidates.
>
> We can think of this as a pie chart with $n$ slices and $n$ borders. We draw one fixed border from the center to the top, and then draw $n-1$ more.
> 
> Now, the probability of the first candidate getting $\geq50\%$ of all votes (shaded area) is equivalent to the probability of all $n-1$ lines being on the unshaded side of the disk, which is $\left(\frac12\right)^{n-1}$.
>
> Since this probability should be the same for every candidate, the overall probability of someone getting at least half of all votes cast is $n\cdot\left(\frac12\right)^{n-1}=\frac n{2^{n-1}}$.
I found with some coding that for my pie chart analogy of the problem, this is indeed correct (yeay!).
However, for the original problem... **I was absolutely wrong!** With some coding (again), I found out that the actual probability is very close to, if not $\frac1{(n-1)!}=\frac n{n!}$.
Why's that? I'm certain it's because the two behave differently, but if that's so I don't get why they do.
**What causes this behavior? Has this problem been studied before, and is this perhaps a branch of probability theory?**
Thanks in advance!