Post History
#3: Post edited
by
 Peter Taylor
·
2022-06-09T14:07:49Z (about 3 years ago)
Peter Taylor
·
2022-06-09T14:07:49Z (about 3 years ago)
- > This is the list of combinations I have found, the result size sequence changes depending on the three values so only the first and last four are always in the same place.
- >
- > ``A||B||C, A||B, A||C, A||(B+C), A, B||C, (A+C)||B, (A+B)||C, B, A+B||C, A||C+B, A+B, C, A||B+C, A+C, B+C, A+B+C``
- I think it's only the first three and last three. This is the Hasse diagram which I obtain: 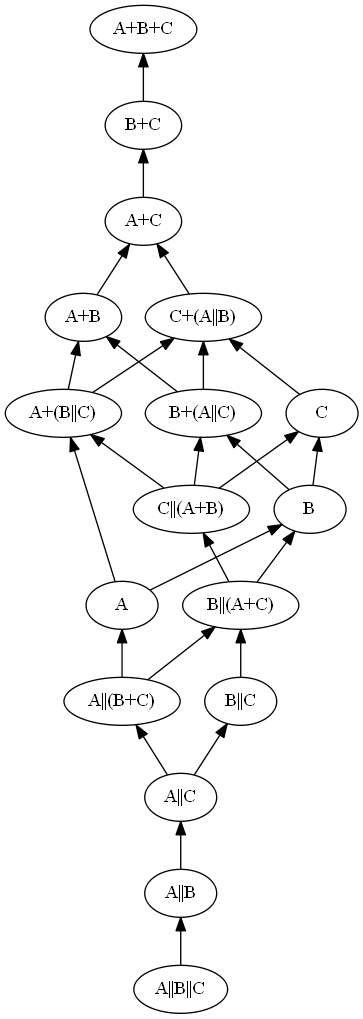
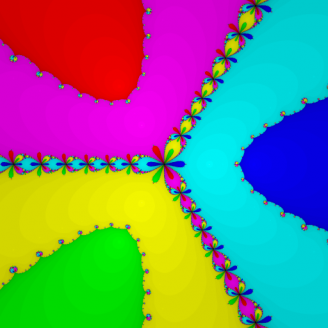
- By considering the contours of equalities between incomparable terms in the Hasse diagram, I obtain this as a "phase diagram" of the possible total orders:
- 
- I count 30 possible total orders.
- > Can I use Excel to goal seek on the R value of a trend line on a plot?
- If this is a question about Excel, I don't know and this isn't the right place to ask. But treating it as a mathematical question about the nature of the goal function within each of the areas on the phase diagram, I think (although I haven't attempted to prove) that it should be smooth enough that hill climbing would work, so it seems like a viable strategy to pick one point away from the edges of each area and goal seek from there.
- There is one additional point to raise about the goal function, which is that you may have a fencepost error. Do you want 17 steps per decade or 17 values and 16 steps?
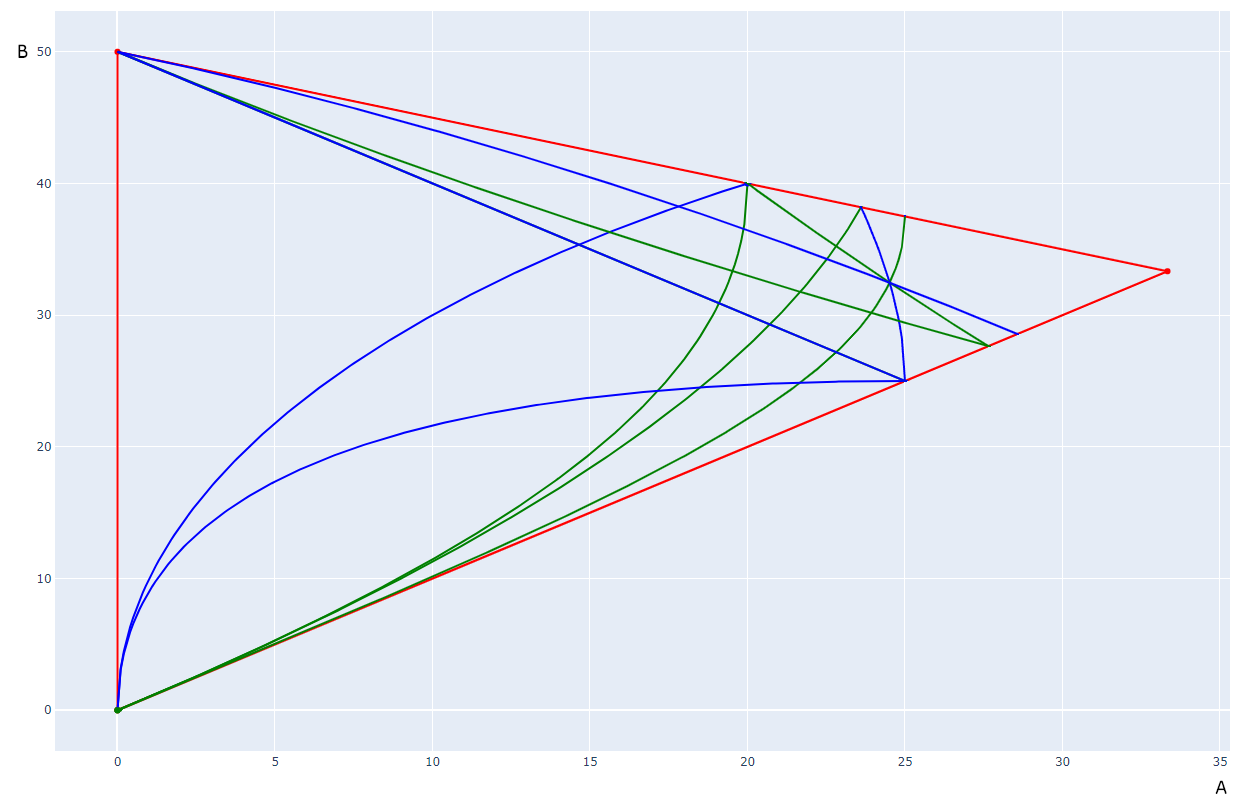
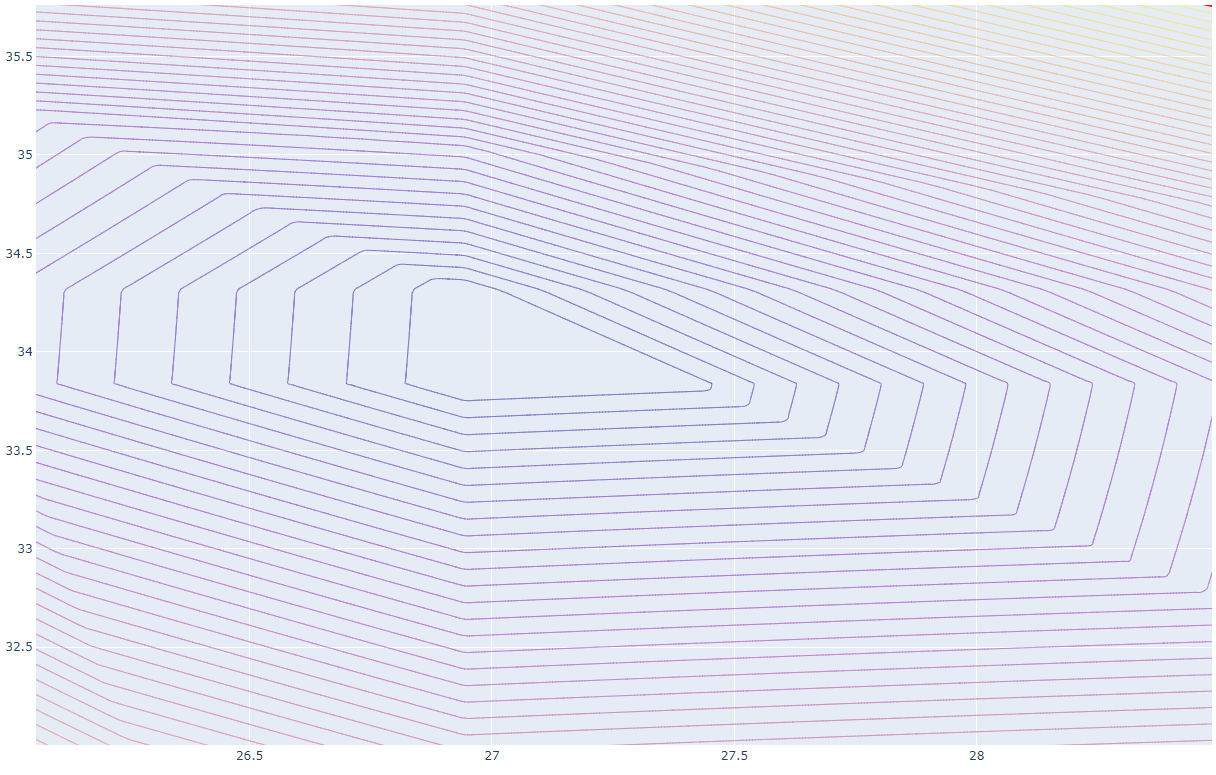
Experimenting with [Plotly](https://plotly.com/python/) and some simpler cost functions (although I think least squares is effectively equivalent to your "R value" cost function), there doesn't seem to be a parameter set which fits within your desired 10% error bound. The best results seem to be $A \approx 27 \pm 0.1$, $B \approx 33.5 \pm 0.5$- [Code](https://gist.github.com/pjt33/374c6f3927145991d4c259f80aaab1a6)
- Graph for least squares (L2 norm applied to errors):
- 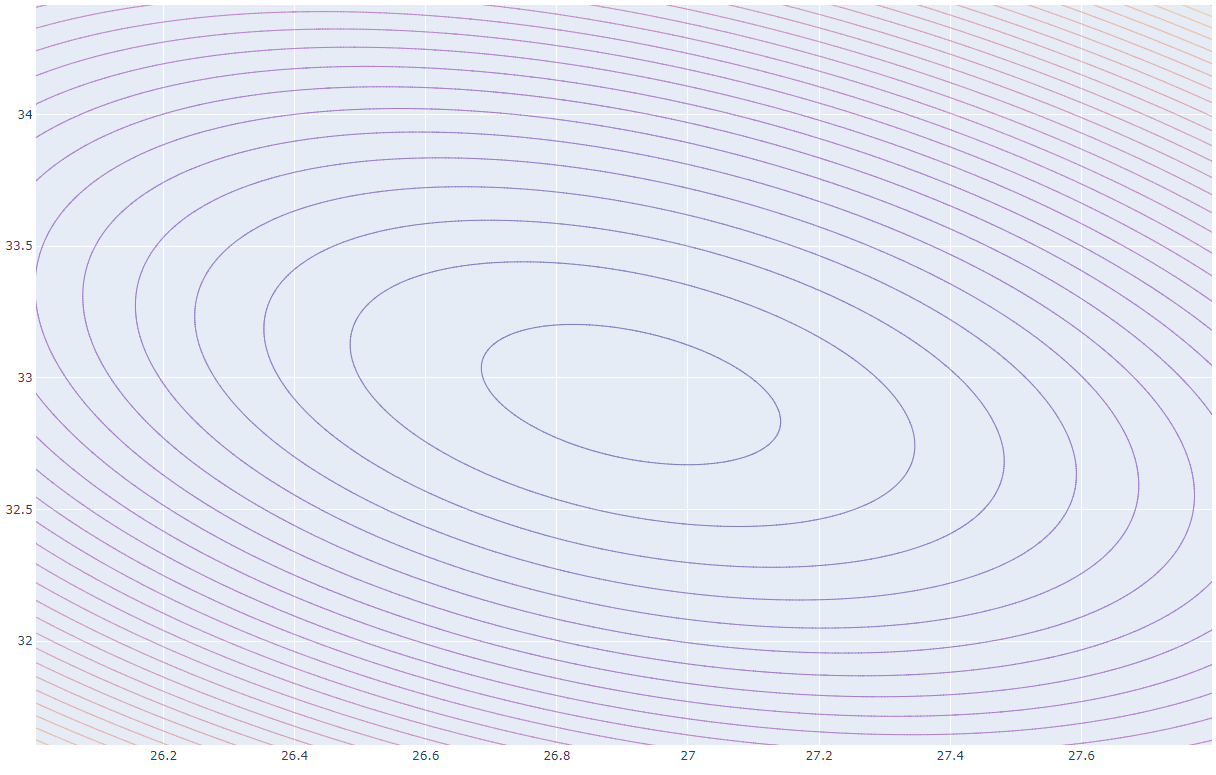
- Graph for total error (L1 norm):
- 
- With a somewhat different goal, if we just aim for even spacing and forget about trying to fit a decade, $A \approx 16.1$, $B \approx 29.6$ is quite good.
- > This is the list of combinations I have found, the result size sequence changes depending on the three values so only the first and last four are always in the same place.
- >
- > ``A||B||C, A||B, A||C, A||(B+C), A, B||C, (A+C)||B, (A+B)||C, B, A+B||C, A||C+B, A+B, C, A||B+C, A+C, B+C, A+B+C``
- I think it's only the first three and last three. This is the Hasse diagram which I obtain: 
- By considering the contours of equalities between incomparable terms in the Hasse diagram, I obtain this as a "phase diagram" of the possible total orders:
- 
- I count 30 possible total orders.
- > Can I use Excel to goal seek on the R value of a trend line on a plot?
- If this is a question about Excel, I don't know and this isn't the right place to ask. But treating it as a mathematical question about the nature of the goal function within each of the areas on the phase diagram, I think (although I haven't attempted to prove) that it should be smooth enough that hill climbing would work, so it seems like a viable strategy to pick one point away from the edges of each area and goal seek from there.
- There is one additional point to raise about the goal function, which is that you may have a fencepost error. Do you want 17 steps per decade or 17 values and 16 steps?
- Experimenting with [Plotly](https://plotly.com/python/) and some simpler cost functions (although I think least squares error from the target line is closer to what you actually want than the "R value"), there doesn't seem to be a parameter set which fits within your desired 10% error bound. The best results seem to be $A \approx 27 \pm 0.1$, $B \approx 33.5 \pm 0.5$
- [Code](https://gist.github.com/pjt33/374c6f3927145991d4c259f80aaab1a6)
- Graph for least squares (L2 norm applied to errors):
- 
- Graph for total error (L1 norm):
- 
- With a somewhat different goal, if we just aim for even spacing and forget about trying to fit a decade, $A \approx 16.1$, $B \approx 29.6$ is quite good.
#2: Post edited
by
Peter Taylor
·
2022-06-09T14:05:22Z (about 3 years ago)
Investigate with some simple cost functions
- > This is the list of combinations I have found, the result size sequence changes depending on the three values so only the first and last four are always in the same place.
- >
- > ``A||B||C, A||B, A||C, A||(B+C), A, B||C, (A+C)||B, (A+B)||C, B, A+B||C, A||C+B, A+B, C, A||B+C, A+C, B+C, A+B+C``
- I think it's only the first three and last three. This is the Hasse diagram which I obtain: 
- By considering the contours of equalities between incomparable terms in the Hasse diagram, I obtain this as a "phase diagram" of the possible total orders:
- 
- I count 30 possible total orders.
- > Can I use Excel to goal seek on the R value of a trend line on a plot?
- If this is a question about Excel, I don't know and this isn't the right place to ask. But treating it as a mathematical question about the nature of the goal function within each of the areas on the phase diagram, I think (although I haven't attempted to prove) that it should be smooth enough that hill climbing would work, so it seems like a viable strategy to pick one point away from the edges of each area and goal seek from there.
There is one additional point to raise about the goal function, which is that you may have a fencepost error. Do you want 17 steps per decade or 17 values and 16 steps?
- > This is the list of combinations I have found, the result size sequence changes depending on the three values so only the first and last four are always in the same place.
- >
- > ``A||B||C, A||B, A||C, A||(B+C), A, B||C, (A+C)||B, (A+B)||C, B, A+B||C, A||C+B, A+B, C, A||B+C, A+C, B+C, A+B+C``
- I think it's only the first three and last three. This is the Hasse diagram which I obtain: 
- By considering the contours of equalities between incomparable terms in the Hasse diagram, I obtain this as a "phase diagram" of the possible total orders:
- 
- I count 30 possible total orders.
- > Can I use Excel to goal seek on the R value of a trend line on a plot?
- If this is a question about Excel, I don't know and this isn't the right place to ask. But treating it as a mathematical question about the nature of the goal function within each of the areas on the phase diagram, I think (although I haven't attempted to prove) that it should be smooth enough that hill climbing would work, so it seems like a viable strategy to pick one point away from the edges of each area and goal seek from there.
- There is one additional point to raise about the goal function, which is that you may have a fencepost error. Do you want 17 steps per decade or 17 values and 16 steps?
- Experimenting with [Plotly](https://plotly.com/python/) and some simpler cost functions (although I think least squares is effectively equivalent to your "R value" cost function), there doesn't seem to be a parameter set which fits within your desired 10% error bound. The best results seem to be $A \approx 27 \pm 0.1$, $B \approx 33.5 \pm 0.5$
- [Code](https://gist.github.com/pjt33/374c6f3927145991d4c259f80aaab1a6)
- Graph for least squares (L2 norm applied to errors):
- 
- Graph for total error (L1 norm):
- 
- With a somewhat different goal, if we just aim for even spacing and forget about trying to fit a decade, $A \approx 16.1$, $B \approx 29.6$ is quite good.
#1: Initial revision
by
Peter Taylor
·
2022-06-08T15:23:54Z (about 3 years ago)
> This is the list of combinations I have found, the result size sequence changes depending on the three values so only the first and last four are always in the same place. > > ``A||B||C, A||B, A||C, A||(B+C), A, B||C, (A+C)||B, (A+B)||C, B, A+B||C, A||C+B, A+B, C, A||B+C, A+C, B+C, A+B+C`` I think it's only the first three and last three. This is the Hasse diagram which I obtain:  By considering the contours of equalities between incomparable terms in the Hasse diagram, I obtain this as a "phase diagram" of the possible total orders:  I count 30 possible total orders. > Can I use Excel to goal seek on the R value of a trend line on a plot? If this is a question about Excel, I don't know and this isn't the right place to ask. But treating it as a mathematical question about the nature of the goal function within each of the areas on the phase diagram, I think (although I haven't attempted to prove) that it should be smooth enough that hill climbing would work, so it seems like a viable strategy to pick one point away from the edges of each area and goal seek from there. There is one additional point to raise about the goal function, which is that you may have a fencepost error. Do you want 17 steps per decade or 17 values and 16 steps?