Post History
#2: Post edited
by
 KalleMP
·
2022-06-06T15:05:38Z (about 3 years ago)
KalleMP
·
2022-06-06T15:05:38Z (about 3 years ago)
fix poor grammar
- I have tried to find a way to optimise value selections so a range of results based on 3 values will be as evenly spaced as possible as close as possible to a geometric series.
- I have a thought experiment that requires the selection of 3 values. These values must have a sum of 100 (not important as final result can be scaled as required but it keeps the numbers civilised) The values can be combines by adding them or by combining the reciprocal or their reciprocals or even a combination of reciprocal and sum. They are all three different in value as experimentation has shown that the distribution of results gets worse if the numbers are the same.
My goal would be to figure out a way to optimise the selection of the numbers such that the error bounds of an exponential increase of a range has the lowest error to any point on a power series.- Is there a mathematical result that will minimise the error or do I just keep messing around with two of the numbers (the third is constrained by the chosen full sum)?
- Can I use Excel to goal seek on the R value of a trend line on a plot?
- This is the list of combinations I have found, the result size sequence changes depending on the three values so only the first and last four are always in the same place.
- ``A||B||C, A||B, A||C, A||(B+C), A, B||C, (A+C)||B, (A+B)||C, B, A+B||C, A||C+B, A+B, C, A||B+C, A+C, B+C, A+B+C``
- **Backstory.**
- This relates to electrical technology and consumer appliance repair and repair technician stock management. I had occasion to look at a list of motor start or run capacitors for appliances on a web store listing. I was rather taken aback by the large selection that was available. They had 74 types with 34 unique electrical values of capacitance. The capacitance spanned 2 decades ranging from 1uF to 100uF.
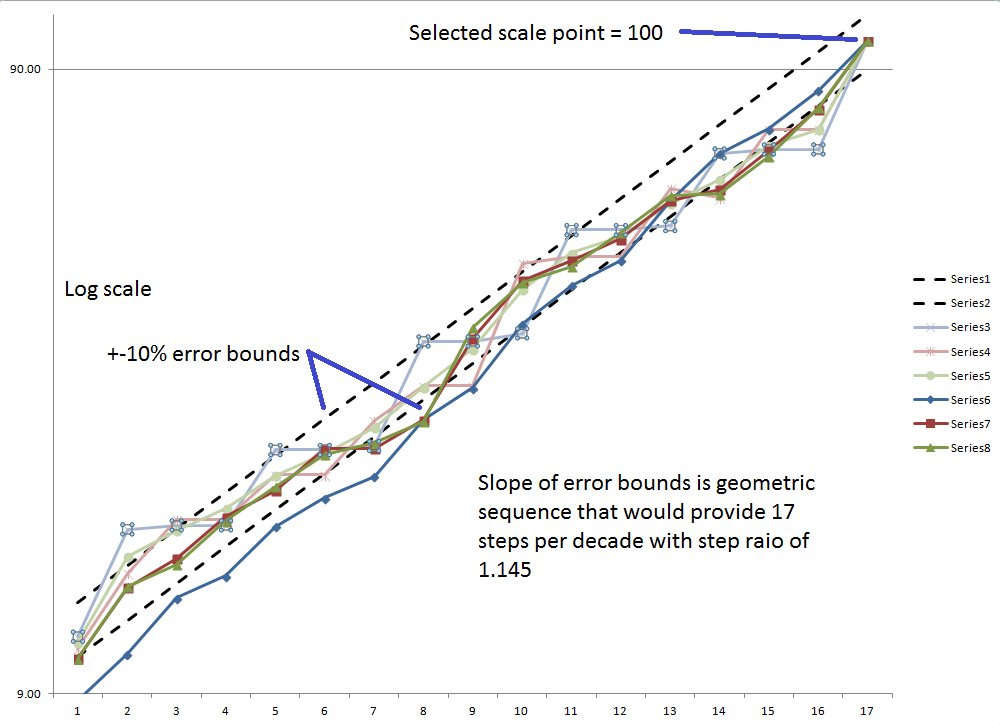
- I though what if a house call technician could stock just two multi section capacitors to cover the full range and configure them on site, so I started to think how many ways can we arrange three capacitor sections in series or parallel and how many evenly spaced values can I find that would allow selection of close fit to desired value with minimal error. Turns out there are 17 combinations I came up with and if one hoped to space them perfectly evenly they should be 1.145 apart in value to fit the 17 possible values in the one decade of capacitance. The idea that a single capacitor that contains 3 elements could be wired up in such combinations to give any value between 1.145uF and 10uF and another unit that would offer values from 11.45uf to 100uf. Certain restrictions came up but I found a close fit with the values 21.739uF, 34.783uF, 43.478uF. They make up 100uF in parallel and 10.230uF in series so not bad. However they do not stay within my +-10% error bars for the geometric sequence that would span the decade.
- My go to mathematical modelling software is Excel but I could try other tools as well, might have to learn VBA to automate testing and error calculations.
- I will insert a random plot of some of the values I was testing. A surprisingly good fit is 22.22uF, 33.33uF and 44.44uF
- 
- I have tried to find a way to optimise value selections so a range of results based on 3 values will be as evenly spaced as possible as close as possible to a geometric series.
- I have a thought experiment that requires the selection of 3 values. These values must have a sum of 100 (not important as final result can be scaled as required but it keeps the numbers civilised) The values can be combines by adding them or by combining the reciprocal or their reciprocals or even a combination of reciprocal and sum. They are all three different in value as experimentation has shown that the distribution of results gets worse if the numbers are the same.
- My goal would be to figure out a way to optimise the selection of the numbers such that the results have the lowest error from a geometric progression.
- Is there a mathematical result that will minimise the error or do I just keep messing around with two of the numbers (the third is constrained by the chosen full sum)?
- Can I use Excel to goal seek on the R value of a trend line on a plot?
- This is the list of combinations I have found, the result size sequence changes depending on the three values so only the first and last four are always in the same place.
- ``A||B||C, A||B, A||C, A||(B+C), A, B||C, (A+C)||B, (A+B)||C, B, A+B||C, A||C+B, A+B, C, A||B+C, A+C, B+C, A+B+C``
- **Backstory.**
- This relates to electrical technology and consumer appliance repair and repair technician stock management. I had occasion to look at a list of motor start or run capacitors for appliances on a web store listing. I was rather taken aback by the large selection that was available. They had 74 types with 34 unique electrical values of capacitance. The capacitance spanned 2 decades ranging from 1uF to 100uF.
- I though what if a house call technician could stock just two multi section capacitors to cover the full range and configure them on site, so I started to think how many ways can we arrange three capacitor sections in series or parallel and how many evenly spaced values can I find that would allow selection of close fit to desired value with minimal error. Turns out there are 17 combinations I came up with and if one hoped to space them perfectly evenly they should be 1.145 apart in value to fit the 17 possible values in the one decade of capacitance. The idea that a single capacitor that contains 3 elements could be wired up in such combinations to give any value between 1.145uF and 10uF and another unit that would offer values from 11.45uf to 100uf. Certain restrictions came up but I found a close fit with the values 21.739uF, 34.783uF, 43.478uF. They make up 100uF in parallel and 10.230uF in series so not bad. However they do not stay within my +-10% error bars for the geometric sequence that would span the decade.
- My go to mathematical modelling software is Excel but I could try other tools as well, might have to learn VBA to automate testing and error calculations.
- I will insert a random plot of some of the values I was testing. A surprisingly good fit is 22.22uF, 33.33uF and 44.44uF
- 
#1: Initial revision
by
KalleMP
·
2022-06-06T15:01:52Z (about 3 years ago)
Optimising a 3 value problem (well 2 really)
I have tried to find a way to optimise value selections so a range of results based on 3 values will be as evenly spaced as possible as close as possible to a geometric series. I have a thought experiment that requires the selection of 3 values. These values must have a sum of 100 (not important as final result can be scaled as required but it keeps the numbers civilised) The values can be combines by adding them or by combining the reciprocal or their reciprocals or even a combination of reciprocal and sum. They are all three different in value as experimentation has shown that the distribution of results gets worse if the numbers are the same. My goal would be to figure out a way to optimise the selection of the numbers such that the error bounds of an exponential increase of a range has the lowest error to any point on a power series. Is there a mathematical result that will minimise the error or do I just keep messing around with two of the numbers (the third is constrained by the chosen full sum)? Can I use Excel to goal seek on the R value of a trend line on a plot? This is the list of combinations I have found, the result size sequence changes depending on the three values so only the first and last four are always in the same place. ``A||B||C, A||B, A||C, A||(B+C), A, B||C, (A+C)||B, (A+B)||C, B, A+B||C, A||C+B, A+B, C, A||B+C, A+C, B+C, A+B+C`` **Backstory.** This relates to electrical technology and consumer appliance repair and repair technician stock management. I had occasion to look at a list of motor start or run capacitors for appliances on a web store listing. I was rather taken aback by the large selection that was available. They had 74 types with 34 unique electrical values of capacitance. The capacitance spanned 2 decades ranging from 1uF to 100uF. I though what if a house call technician could stock just two multi section capacitors to cover the full range and configure them on site, so I started to think how many ways can we arrange three capacitor sections in series or parallel and how many evenly spaced values can I find that would allow selection of close fit to desired value with minimal error. Turns out there are 17 combinations I came up with and if one hoped to space them perfectly evenly they should be 1.145 apart in value to fit the 17 possible values in the one decade of capacitance. The idea that a single capacitor that contains 3 elements could be wired up in such combinations to give any value between 1.145uF and 10uF and another unit that would offer values from 11.45uf to 100uf. Certain restrictions came up but I found a close fit with the values 21.739uF, 34.783uF, 43.478uF. They make up 100uF in parallel and 10.230uF in series so not bad. However they do not stay within my +-10% error bars for the geometric sequence that would span the decade. My go to mathematical modelling software is Excel but I could try other tools as well, might have to learn VBA to automate testing and error calculations. I will insert a random plot of some of the values I was testing. A surprisingly good fit is 22.22uF, 33.33uF and 44.44uF 