Post History
#7: Post edited
by
 DNB
·
2021-08-27T09:10:11Z (almost 4 years ago)
DNB
·
2021-08-27T09:10:11Z (almost 4 years ago)
- $\forall a,b,c,d > 0, a<b, c<d \implies$ [$0 \le ab < cd$](https://math.stackexchange.com/q/3632752).
- 1. The blue, orange and purple inequalities below are all in the _OPPOSITE_ direction as $P(A|B)>P(A|B^C)$! I can multiply the blue and orange inequalities together, but their product is in the opposite direction too!
2. I can't simply multiple the purple inequality by the green inequality, because the green inequality's in the _SAME_ direction as $P(A|B)>P(A|B^C)$.- I modified this example to make it easier to understand.
- >### Example 2.8.3 (Simpson's paradox).
- >Two doctors, Dr. Good and Dr. Bad, each perform two types of surgeries: cardiac surgery and Band-Aid removal. Each surgery can be either a success or a failure. The two doctors' respective records are given in the following tables, and shown graphically in Figure 2.6, where white dots represent
- successful surgeries and black dots represent failed surgeries.
- 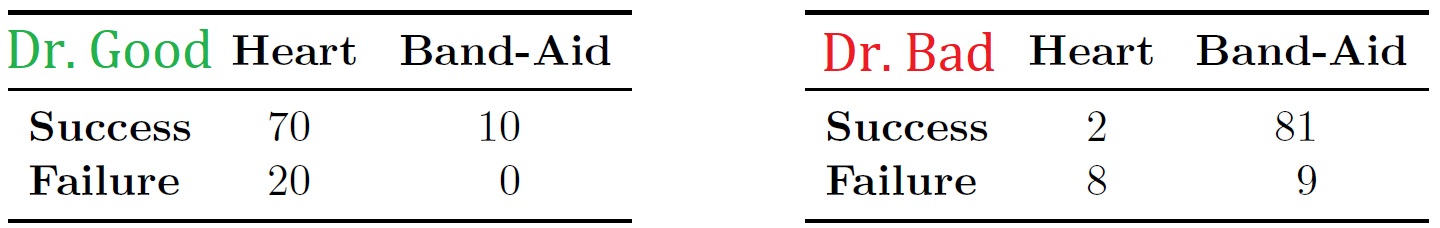
- >Dr. Good had a higher success rate than Dr. Bad in heart surgeries: 70 out of 90 versus 2 out of 10. Dr. Good also had a higher success rate in Band-Aid removal: 10 out of 10 versus 81 out of 90. But if we aggregate across the two types of surgeries to compare overall surgery success rates, Dr. Good was successful in 80 out of 100 surgeries while Dr. Bad was successful in 83 out of 100 surgeries: Dr. Bad's overall success rate is higher!
- 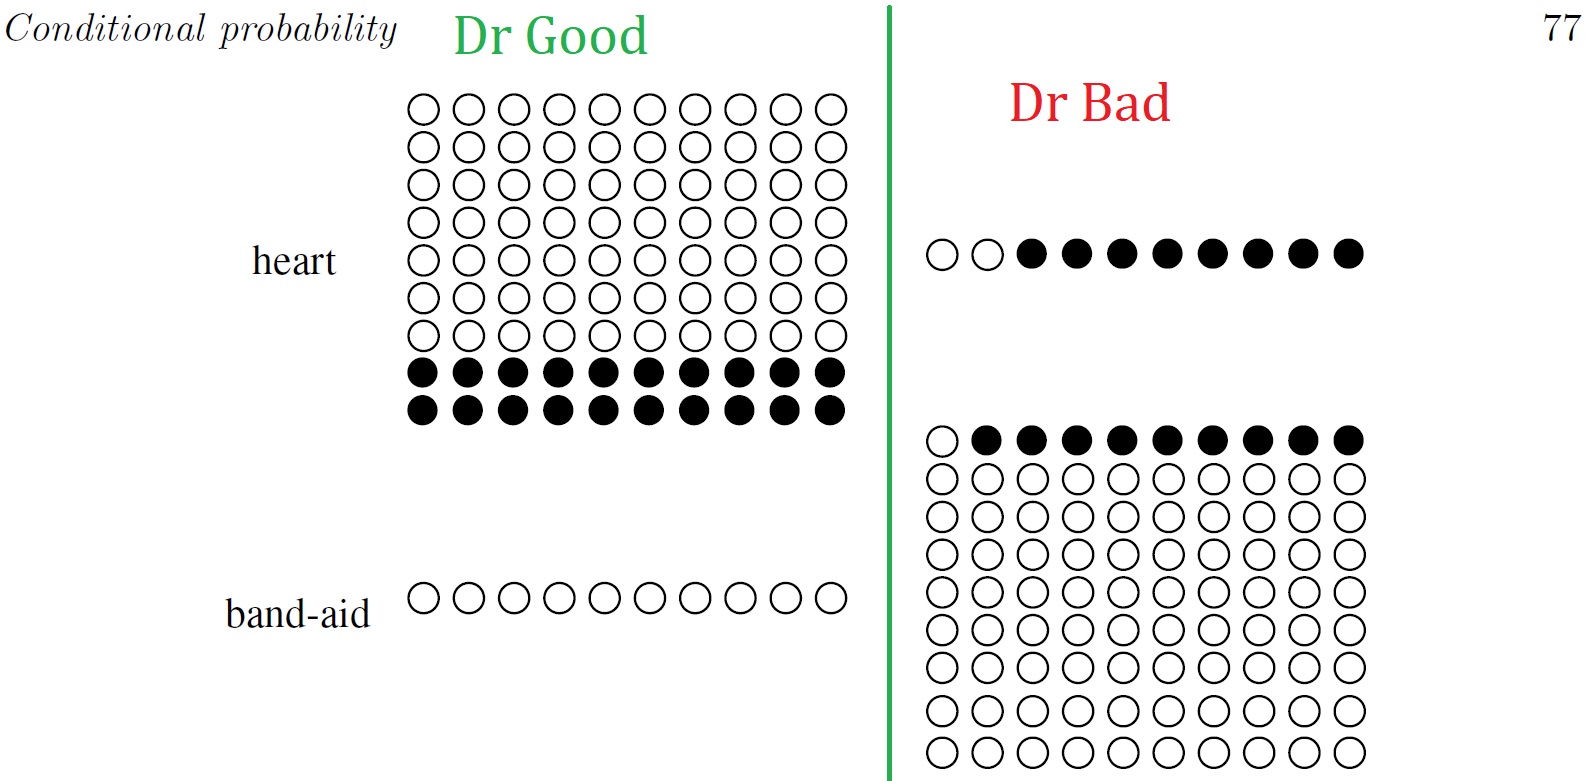
- >**FIGURE 2.6**
- An example of Simpson's paradox. White dots represent successful surgeries and
- black dots represent failed surgeries. Dr. Good is better in both types of surgery but has a lower overall success rate, because he is performing the harder type of surgery much more often than Dr. Bad is.
- >
- >What's happening is that Dr. Good, presumably due to his reputation as the
- superior doctor, is performing a greater number of cardiac surgeries, which are inherently riskier than Band-Aid removals. His overall success rate is lower not because of lesser skill on any particular type of surgery, but because a larger fraction of his surgeries are risky.
- >
- >Let's use event notation to make this precise. For events A, B, and C, we say that we have a Simpson's paradox if
- \begin{align*}
- P(A|B,C) &<P(A|B^C,C)\newline
- P(A|B,C^C) &<P(A|B^C, C^C);\newline
- \text{but }P(A|B) &>P(A|B^C).
- \end{align*}
- >In this case, let A be the event of a successful surgery, B be the event that Dr. Bad is the surgeon, and C be the event that the surgery is a cardiac surgery. The conditions for Simpson's paradox are fulfilled because the probability of a successful surgery is lower under Dr. Bad than under Dr. Good whether we condition on heart surgery or on Band-Aid removal, but the overall probability of success is higher for Dr. Bad.
- 
- Blitzstein. *Introduction to Probability* (2019 2 ed). pp 76-78.
- $\forall a,b,c,d > 0, a<b, c<d \implies$ [$0 \le ab < cd$](https://math.stackexchange.com/q/3632752).
- 1. The blue, orange and purple inequalities below are all in the _OPPOSITE_ direction as $P(A|B)>P(A|B^C)$! I can multiply the blue and orange inequalities together, but their product is in the opposite direction too!
- 2. I can't simply multiply the purple inequality by the green inequality, because the green inequality's in the _SAME_ direction as $P(A|B)>P(A|B^C)$.
- I modified this example to make it easier to understand.
- >### Example 2.8.3 (Simpson's paradox).
- >Two doctors, Dr. Good and Dr. Bad, each perform two types of surgeries: cardiac surgery and Band-Aid removal. Each surgery can be either a success or a failure. The two doctors' respective records are given in the following tables, and shown graphically in Figure 2.6, where white dots represent
- successful surgeries and black dots represent failed surgeries.
- 
- >Dr. Good had a higher success rate than Dr. Bad in heart surgeries: 70 out of 90 versus 2 out of 10. Dr. Good also had a higher success rate in Band-Aid removal: 10 out of 10 versus 81 out of 90. But if we aggregate across the two types of surgeries to compare overall surgery success rates, Dr. Good was successful in 80 out of 100 surgeries while Dr. Bad was successful in 83 out of 100 surgeries: Dr. Bad's overall success rate is higher!
- 
- >**FIGURE 2.6**
- An example of Simpson's paradox. White dots represent successful surgeries and
- black dots represent failed surgeries. Dr. Good is better in both types of surgery but has a lower overall success rate, because he is performing the harder type of surgery much more often than Dr. Bad is.
- >
- >What's happening is that Dr. Good, presumably due to his reputation as the
- superior doctor, is performing a greater number of cardiac surgeries, which are inherently riskier than Band-Aid removals. His overall success rate is lower not because of lesser skill on any particular type of surgery, but because a larger fraction of his surgeries are risky.
- >
- >Let's use event notation to make this precise. For events A, B, and C, we say that we have a Simpson's paradox if
- \begin{align*}
- P(A|B,C) &<P(A|B^C,C)\newline
- P(A|B,C^C) &<P(A|B^C, C^C);\newline
- \text{but }P(A|B) &>P(A|B^C).
- \end{align*}
- >In this case, let A be the event of a successful surgery, B be the event that Dr. Bad is the surgeon, and C be the event that the surgery is a cardiac surgery. The conditions for Simpson's paradox are fulfilled because the probability of a successful surgery is lower under Dr. Bad than under Dr. Good whether we condition on heart surgery or on Band-Aid removal, but the overall probability of success is higher for Dr. Bad.
- 
- Blitzstein. *Introduction to Probability* (2019 2 ed). pp 76-78.
#6: Post edited
by
 JRN
·
2021-08-27T09:09:47Z (almost 4 years ago)
JRN
·
2021-08-27T09:09:47Z (almost 4 years ago)
Fixed formatting
How do I prove Simpson's Paradox, scilicet $P(A|B) > P(A|B^C)$?
$\forall a,b,c,d > 0$, $a < b, c< d \implies [0 \le ab < cd](https://math.stackexchange.com/q/3632752)$.1. The blue, orange and purple inequalities below are all in the _OPPOSITE _direction as $P(A|B) > P(A|B^C)$! I can multiply the blue and orange inequalities together, but their product is in the opposite direction too!2. I can't simply multiple the purple inequality by the green inequality, because the green inequality's in the _SAME_ direction as $P(A|B) > P(A|B^C)$.- I modified this example to make it easier to understand.
- >### Example 2.8.3 (Simpson's paradox).
>Two doctors, Dr. Good and Dr. Bad, eachperform two types of surgeries: cardiac surgery and Band-Aid removal. Each surgerycan be either a success or a failure. The two doctors' respective records are given inthe following tables, and shown graphically in Figure 2.6, where white dots represent- successful surgeries and black dots represent failed surgeries.
- 
>Dr. Good had a higher success rate than Dr. Bad in heart surgeries: 70 out of 90versus 2 out of 10. Dr. Good also had a higher success rate in Band-Aid removal:10 out of 10 versus 81 out of 90. But if we aggregate across the two types of surgeriesto compare overall surgery success rates, Dr. Good was successful in 80 out of100 surgeries while Dr. Bad was successful in 83 out of 100 surgeries: Dr. Bad'soverall success rate is higher!- 
- >**FIGURE 2.6**
- An example of Simpson's paradox. White dots represent successful surgeries and
black dots represent failed surgeries. Dr. Good is better in both types of surgerybut has a lower overall success rate, because he is performing the harder type ofsurgery much more often than Dr. Bad is.- >
- >What's happening is that Dr. Good, presumably due to his reputation as the
superior doctor, is performing a greater number of cardiac surgeries, which are inherentlyriskier than Band-Aid removals. His overall success rate is lower not becauseof lesser skill on any particular type of surgery, but because a larger fraction of hissurgeries are risky.- >
>Let's use event notation to make this precise. For events A, B, and C, we say thatwe have a Simpson's paradox if>>$\begin{align}P(A|B,C) & < P(A|B^C,C) \\$P(A|B,C^cC & < P(A|B^C, C^C)$; \\but $P(A|B) & > P(A|B^C)\end{align}$.>>In this case, let A be the event of a successful surgery, B be the event that Dr. Badis the surgeon, and C be the event that the surgery is a cardiac surgery. The conditionsfor Simpson's paradox are ful filled because the probability of a successful surgeryis lower under Dr. Bad than under Dr. Good whether we condition on heartsurgery or on Band-Aid removal, but the overall probability of success is higher forDr. Bad.- 
Blitzstein. *Introduction to Probability* (2019 2 ed). pp 76-78.
- $\forall a,b,c,d > 0, a<b, c<d \implies$ [$0 \le ab < cd$](https://math.stackexchange.com/q/3632752).
- 1. The blue, orange and purple inequalities below are all in the _OPPOSITE_ direction as $P(A|B)>P(A|B^C)$! I can multiply the blue and orange inequalities together, but their product is in the opposite direction too!
- 2. I can't simply multiple the purple inequality by the green inequality, because the green inequality's in the _SAME_ direction as $P(A|B)>P(A|B^C)$.
- I modified this example to make it easier to understand.
- >### Example 2.8.3 (Simpson's paradox).
- >Two doctors, Dr. Good and Dr. Bad, each perform two types of surgeries: cardiac surgery and Band-Aid removal. Each surgery can be either a success or a failure. The two doctors' respective records are given in the following tables, and shown graphically in Figure 2.6, where white dots represent
- successful surgeries and black dots represent failed surgeries.
- 
- >Dr. Good had a higher success rate than Dr. Bad in heart surgeries: 70 out of 90 versus 2 out of 10. Dr. Good also had a higher success rate in Band-Aid removal: 10 out of 10 versus 81 out of 90. But if we aggregate across the two types of surgeries to compare overall surgery success rates, Dr. Good was successful in 80 out of 100 surgeries while Dr. Bad was successful in 83 out of 100 surgeries: Dr. Bad's overall success rate is higher!
- 
- >**FIGURE 2.6**
- An example of Simpson's paradox. White dots represent successful surgeries and
- black dots represent failed surgeries. Dr. Good is better in both types of surgery but has a lower overall success rate, because he is performing the harder type of surgery much more often than Dr. Bad is.
- >
- >What's happening is that Dr. Good, presumably due to his reputation as the
- superior doctor, is performing a greater number of cardiac surgeries, which are inherently riskier than Band-Aid removals. His overall success rate is lower not because of lesser skill on any particular type of surgery, but because a larger fraction of his surgeries are risky.
- >
- >Let's use event notation to make this precise. For events A, B, and C, we say that we have a Simpson's paradox if
- \begin{align*}
- P(A|B,C) &<P(A|B^C,C)\newline
- P(A|B,C^C) &<P(A|B^C, C^C);\newline
- \text{but }P(A|B) &>P(A|B^C).
- \end{align*}
- >In this case, let A be the event of a successful surgery, B be the event that Dr. Bad is the surgeon, and C be the event that the surgery is a cardiac surgery. The conditions for Simpson's paradox are fulfilled because the probability of a successful surgery is lower under Dr. Bad than under Dr. Good whether we condition on heart surgery or on Band-Aid removal, but the overall probability of success is higher for Dr. Bad.
- 
- Blitzstein. *Introduction to Probability* (2019 2 ed). pp 76-78.
#5: Post edited
by
DNB
·
2021-08-19T07:30:33Z (almost 4 years ago)
- $\forall a,b,c,d > 0$, $a < b, c< d \implies [0 \le ab < cd](https://math.stackexchange.com/q/3632752)$.
The first snag is that the blue and orange inequalities below are in the opposite direction as $P(A|B) > P(A|B^C)$! I can multiply them together, but their product is in the opposite direction too!Snag #2 is the purple inequality, because it's in the opposite direction too as $P(A|B) > P(A|B^C)$! So I can't simply multiple the purple inequality by the green inequality, because the green inequality's in the same direction as $P(A|B) > P(A|B^C)$.- I modified this example to make it easier to understand.
- >### Example 2.8.3 (Simpson's paradox).
- >Two doctors, Dr. Good and Dr. Bad, each
- perform two types of surgeries: cardiac surgery and Band-Aid removal. Each surgery
- can be either a success or a failure. The two doctors' respective records are given in
- the following tables, and shown graphically in Figure 2.6, where white dots represent
- successful surgeries and black dots represent failed surgeries.
- 
- >Dr. Good had a higher success rate than Dr. Bad in heart surgeries: 70 out of 90
- versus 2 out of 10. Dr. Good also had a higher success rate in Band-Aid removal:
- 10 out of 10 versus 81 out of 90. But if we aggregate across the two types of surgeries
- to compare overall surgery success rates, Dr. Good was successful in 80 out of
- 100 surgeries while Dr. Bad was successful in 83 out of 100 surgeries: Dr. Bad's
- overall success rate is higher!
- 
- >**FIGURE 2.6**
- An example of Simpson's paradox. White dots represent successful surgeries and
- black dots represent failed surgeries. Dr. Good is better in both types of surgery
- but has a lower overall success rate, because he is performing the harder type of
- surgery much more often than Dr. Bad is.
- >
- >What's happening is that Dr. Good, presumably due to his reputation as the
- superior doctor, is performing a greater number of cardiac surgeries, which are inherently
- riskier than Band-Aid removals. His overall success rate is lower not because
- of lesser skill on any particular type of surgery, but because a larger fraction of his
- surgeries are risky.
- >
- >Let's use event notation to make this precise. For events A, B, and C, we say that
- we have a Simpson's paradox if
- >
- >$\begin{align}
- P(A|B,C) & < P(A|B^C,C) \\
- $P(A|B,C^cC & < P(A|B^C, C^C)$; \\
- but $P(A|B) & > P(A|B^C)
- \end{align}$.
- >
- >In this case, let A be the event of a successful surgery, B be the event that Dr. Bad
- is the surgeon, and C be the event that the surgery is a cardiac surgery. The conditions
- for Simpson's paradox are ful filled because the probability of a successful surgery
- is lower under Dr. Bad than under Dr. Good whether we condition on heart
- surgery or on Band-Aid removal, but the overall probability of success is higher for
- Dr. Bad.
- 
- Blitzstein. *Introduction to Probability* (2019 2 ed). pp 76-78.
- $\forall a,b,c,d > 0$, $a < b, c< d \implies [0 \le ab < cd](https://math.stackexchange.com/q/3632752)$.
- 1. The blue, orange and purple inequalities below are all in the _OPPOSITE _direction as $P(A|B) > P(A|B^C)$! I can multiply the blue and orange inequalities together, but their product is in the opposite direction too!
- 2. I can't simply multiple the purple inequality by the green inequality, because the green inequality's in the _SAME_ direction as $P(A|B) > P(A|B^C)$.
- I modified this example to make it easier to understand.
- >### Example 2.8.3 (Simpson's paradox).
- >Two doctors, Dr. Good and Dr. Bad, each
- perform two types of surgeries: cardiac surgery and Band-Aid removal. Each surgery
- can be either a success or a failure. The two doctors' respective records are given in
- the following tables, and shown graphically in Figure 2.6, where white dots represent
- successful surgeries and black dots represent failed surgeries.
- 
- >Dr. Good had a higher success rate than Dr. Bad in heart surgeries: 70 out of 90
- versus 2 out of 10. Dr. Good also had a higher success rate in Band-Aid removal:
- 10 out of 10 versus 81 out of 90. But if we aggregate across the two types of surgeries
- to compare overall surgery success rates, Dr. Good was successful in 80 out of
- 100 surgeries while Dr. Bad was successful in 83 out of 100 surgeries: Dr. Bad's
- overall success rate is higher!
- 
- >**FIGURE 2.6**
- An example of Simpson's paradox. White dots represent successful surgeries and
- black dots represent failed surgeries. Dr. Good is better in both types of surgery
- but has a lower overall success rate, because he is performing the harder type of
- surgery much more often than Dr. Bad is.
- >
- >What's happening is that Dr. Good, presumably due to his reputation as the
- superior doctor, is performing a greater number of cardiac surgeries, which are inherently
- riskier than Band-Aid removals. His overall success rate is lower not because
- of lesser skill on any particular type of surgery, but because a larger fraction of his
- surgeries are risky.
- >
- >Let's use event notation to make this precise. For events A, B, and C, we say that
- we have a Simpson's paradox if
- >
- >$\begin{align}
- P(A|B,C) & < P(A|B^C,C) \\
- $P(A|B,C^cC & < P(A|B^C, C^C)$; \\
- but $P(A|B) & > P(A|B^C)
- \end{align}$.
- >
- >In this case, let A be the event of a successful surgery, B be the event that Dr. Bad
- is the surgeon, and C be the event that the surgery is a cardiac surgery. The conditions
- for Simpson's paradox are ful filled because the probability of a successful surgery
- is lower under Dr. Bad than under Dr. Good whether we condition on heart
- surgery or on Band-Aid removal, but the overall probability of success is higher for
- Dr. Bad.
- 
- Blitzstein. *Introduction to Probability* (2019 2 ed). pp 76-78.
#4: Post edited
by
DNB
·
2021-08-19T00:26:38Z (almost 4 years ago)
- $\forall a,b,c,d > 0$, $a < b, c< d \implies [0 \le ab < cd](https://math.stackexchange.com/q/3632752)$.
- The first snag is that the blue and orange inequalities below are in the opposite direction as $P(A|B) > P(A|B^C)$! I can multiply them together, but their product is in the opposite direction too!
- Snag #2 is the purple inequality, because it's in the opposite direction too as $P(A|B) > P(A|B^C)$! So I can't simply multiple the purple inequality by the green inequality, because the green inequality's in the same direction as $P(A|B) > P(A|B^C)$.
- I modified this example to make it easier to understand.
- >### Example 2.8.3 (Simpson's paradox).
- >Two doctors, Dr. Good and Dr. Bad, each
- perform two types of surgeries: cardiac surgery and Band-Aid removal. Each surgery
- can be either a success or a failure. The two doctors' respective records are given in
- the following tables, and shown graphically in Figure 2.6, where white dots represent
- successful surgeries and black dots represent failed surgeries.
- 
- >Dr. Good had a higher success rate than Dr. Bad in heart surgeries: 70 out of 90
- versus 2 out of 10. Dr. Good also had a higher success rate in Band-Aid removal:
- 10 out of 10 versus 81 out of 90. But if we aggregate across the two types of surgeries
- to compare overall surgery success rates, Dr. Good was successful in 80 out of
- 100 surgeries while Dr. Bad was successful in 83 out of 100 surgeries: Dr. Bad's
- overall success rate is higher!
- 
- >**FIGURE 2.6**
- An example of Simpson's paradox. White dots represent successful surgeries and
- black dots represent failed surgeries. Dr. Good is better in both types of surgery
- but has a lower overall success rate, because he is performing the harder type of
- surgery much more often than Dr. Bad is.
- >
- >What's happening is that Dr. Good, presumably due to his reputation as the
- superior doctor, is performing a greater number of cardiac surgeries, which are inherently
- riskier than Band-Aid removals. His overall success rate is lower not because
- of lesser skill on any particular type of surgery, but because a larger fraction of his
- surgeries are risky.
- >
- >Let's use event notation to make this precise. For events A, B, and C, we say that
- we have a Simpson's paradox if
- >
- >$\begin{align}
- P(A|B,C) & < P(A|B^C,C) \\
- $P(A|B,C^cC & < P(A|B^C, C^C)$; \\
- but $P(A|B) & > P(A|B^C)
- \end{align}$.
- >
- >In this case, let A be the event of a successful surgery, B be the event that Dr. Bad
- is the surgeon, and C be the event that the surgery is a cardiac surgery. The conditions
- for Simpson's paradox are ful filled because the probability of a successful surgery
- is lower under Dr. Bad than under Dr. Good whether we condition on heart
- surgery or on Band-Aid removal, but the overall probability of success is higher for
- Dr. Bad.
- Blitzstein. *Introduction to Probability* (2019 2 ed). pp 76-78.
- $\forall a,b,c,d > 0$, $a < b, c< d \implies [0 \le ab < cd](https://math.stackexchange.com/q/3632752)$.
- The first snag is that the blue and orange inequalities below are in the opposite direction as $P(A|B) > P(A|B^C)$! I can multiply them together, but their product is in the opposite direction too!
- Snag #2 is the purple inequality, because it's in the opposite direction too as $P(A|B) > P(A|B^C)$! So I can't simply multiple the purple inequality by the green inequality, because the green inequality's in the same direction as $P(A|B) > P(A|B^C)$.
- I modified this example to make it easier to understand.
- >### Example 2.8.3 (Simpson's paradox).
- >Two doctors, Dr. Good and Dr. Bad, each
- perform two types of surgeries: cardiac surgery and Band-Aid removal. Each surgery
- can be either a success or a failure. The two doctors' respective records are given in
- the following tables, and shown graphically in Figure 2.6, where white dots represent
- successful surgeries and black dots represent failed surgeries.
- 
- >Dr. Good had a higher success rate than Dr. Bad in heart surgeries: 70 out of 90
- versus 2 out of 10. Dr. Good also had a higher success rate in Band-Aid removal:
- 10 out of 10 versus 81 out of 90. But if we aggregate across the two types of surgeries
- to compare overall surgery success rates, Dr. Good was successful in 80 out of
- 100 surgeries while Dr. Bad was successful in 83 out of 100 surgeries: Dr. Bad's
- overall success rate is higher!
- 
- >**FIGURE 2.6**
- An example of Simpson's paradox. White dots represent successful surgeries and
- black dots represent failed surgeries. Dr. Good is better in both types of surgery
- but has a lower overall success rate, because he is performing the harder type of
- surgery much more often than Dr. Bad is.
- >
- >What's happening is that Dr. Good, presumably due to his reputation as the
- superior doctor, is performing a greater number of cardiac surgeries, which are inherently
- riskier than Band-Aid removals. His overall success rate is lower not because
- of lesser skill on any particular type of surgery, but because a larger fraction of his
- surgeries are risky.
- >
- >Let's use event notation to make this precise. For events A, B, and C, we say that
- we have a Simpson's paradox if
- >
- >$\begin{align}
- P(A|B,C) & < P(A|B^C,C) \\
- $P(A|B,C^cC & < P(A|B^C, C^C)$; \\
- but $P(A|B) & > P(A|B^C)
- \end{align}$.
- >
- >In this case, let A be the event of a successful surgery, B be the event that Dr. Bad
- is the surgeon, and C be the event that the surgery is a cardiac surgery. The conditions
- for Simpson's paradox are ful filled because the probability of a successful surgery
- is lower under Dr. Bad than under Dr. Good whether we condition on heart
- surgery or on Band-Aid removal, but the overall probability of success is higher for
- Dr. Bad.
- 
- Blitzstein. *Introduction to Probability* (2019 2 ed). pp 76-78.
#3: Post edited
by
DNB
·
2021-08-14T08:33:16Z (almost 4 years ago)
If $a,b,c,d \ge 0$, $a < b, c< d$, then [$0 \le ab < cd$](https://math.stackexchange.com/q/3632752).The first snag is that the blue and orange inequalities are in the opposite direction as $P(A|B) > P(A|B^C)$! I can multiply them together, but their product is also in the opposite direction.Snag #2 is the purple inequality underlined in purple, because it's in the opposite direction too! So I can't simply multiple the purple inequality by the green inequality!I've modified this example to make it easier to understand.- >### Example 2.8.3 (Simpson's paradox).
- >Two doctors, Dr. Good and Dr. Bad, each
- perform two types of surgeries: cardiac surgery and Band-Aid removal. Each surgery
- can be either a success or a failure. The two doctors' respective records are given in
- the following tables, and shown graphically in Figure 2.6, where white dots represent
- successful surgeries and black dots represent failed surgeries.
- 
- >Dr. Good had a higher success rate than Dr. Bad in heart surgeries: 70 out of 90
- versus 2 out of 10. Dr. Good also had a higher success rate in Band-Aid removal:
- 10 out of 10 versus 81 out of 90. But if we aggregate across the two types of surgeries
- to compare overall surgery success rates, Dr. Good was successful in 80 out of
- 100 surgeries while Dr. Bad was successful in 83 out of 100 surgeries: Dr. Bad's
- overall success rate is higher!
- 
- >**FIGURE 2.6**
- An example of Simpson's paradox. White dots represent successful surgeries and
- black dots represent failed surgeries. Dr. Good is better in both types of surgery
- but has a lower overall success rate, because he is performing the harder type of
- surgery much more often than Dr. Bad is.
- >
- >What's happening is that Dr. Good, presumably due to his reputation as the
- superior doctor, is performing a greater number of cardiac surgeries, which are inherently
- riskier than Band-Aid removals. His overall success rate is lower not because
- of lesser skill on any particular type of surgery, but because a larger fraction of his
- surgeries are risky.
- >
- >Let's use event notation to make this precise. For events A, B, and C, we say that
- we have a Simpson's paradox if
- >
- >$\begin{align}
- P(A|B,C) & < P(A|B^C,C) \\
- $P(A|B,C^cC & < P(A|B^C, C^C)$; \\
- but $P(A|B) & > P(A|B^C)
- \end{align}$.
- >
- >In this case, let A be the event of a successful surgery, B be the event that Dr. Bad
- is the surgeon, and C be the event that the surgery is a cardiac surgery. The conditions
- for Simpson's paradox are ful filled because the probability of a successful surgery
- is lower under Dr. Bad than under Dr. Good whether we condition on heart
- surgery or on Band-Aid removal, but the overall probability of success is higher for
- Dr. Bad.
- 
- Blitzstein. *Introduction to Probability* (2019 2 ed). pp 76-78.
- $\forall a,b,c,d > 0$, $a < b, c< d \implies [0 \le ab < cd](https://math.stackexchange.com/q/3632752)$.
- The first snag is that the blue and orange inequalities below are in the opposite direction as $P(A|B) > P(A|B^C)$! I can multiply them together, but their product is in the opposite direction too!
- Snag #2 is the purple inequality, because it's in the opposite direction too as $P(A|B) > P(A|B^C)$! So I can't simply multiple the purple inequality by the green inequality, because the green inequality's in the same direction as $P(A|B) > P(A|B^C)$.
- I modified this example to make it easier to understand.
- >### Example 2.8.3 (Simpson's paradox).
- >Two doctors, Dr. Good and Dr. Bad, each
- perform two types of surgeries: cardiac surgery and Band-Aid removal. Each surgery
- can be either a success or a failure. The two doctors' respective records are given in
- the following tables, and shown graphically in Figure 2.6, where white dots represent
- successful surgeries and black dots represent failed surgeries.
- 
- >Dr. Good had a higher success rate than Dr. Bad in heart surgeries: 70 out of 90
- versus 2 out of 10. Dr. Good also had a higher success rate in Band-Aid removal:
- 10 out of 10 versus 81 out of 90. But if we aggregate across the two types of surgeries
- to compare overall surgery success rates, Dr. Good was successful in 80 out of
- 100 surgeries while Dr. Bad was successful in 83 out of 100 surgeries: Dr. Bad's
- overall success rate is higher!
- 
- >**FIGURE 2.6**
- An example of Simpson's paradox. White dots represent successful surgeries and
- black dots represent failed surgeries. Dr. Good is better in both types of surgery
- but has a lower overall success rate, because he is performing the harder type of
- surgery much more often than Dr. Bad is.
- >
- >What's happening is that Dr. Good, presumably due to his reputation as the
- superior doctor, is performing a greater number of cardiac surgeries, which are inherently
- riskier than Band-Aid removals. His overall success rate is lower not because
- of lesser skill on any particular type of surgery, but because a larger fraction of his
- surgeries are risky.
- >
- >Let's use event notation to make this precise. For events A, B, and C, we say that
- we have a Simpson's paradox if
- >
- >$\begin{align}
- P(A|B,C) & < P(A|B^C,C) \\
- $P(A|B,C^cC & < P(A|B^C, C^C)$; \\
- but $P(A|B) & > P(A|B^C)
- \end{align}$.
- >
- >In this case, let A be the event of a successful surgery, B be the event that Dr. Bad
- is the surgeon, and C be the event that the surgery is a cardiac surgery. The conditions
- for Simpson's paradox are ful filled because the probability of a successful surgery
- is lower under Dr. Bad than under Dr. Good whether we condition on heart
- surgery or on Band-Aid removal, but the overall probability of success is higher for
- Dr. Bad.
- 
- Blitzstein. *Introduction to Probability* (2019 2 ed). pp 76-78.
#2: Post edited
by
DNB
·
2021-08-14T08:30:43Z (almost 4 years ago)
- I've modified this example to make it easier to understand.
- >### Example 2.8.3 (Simpson's paradox).
- >Two doctors, Dr. Good and Dr. Bad, each
- perform two types of surgeries: cardiac surgery and Band-Aid removal. Each surgery
- can be either a success or a failure. The two doctors' respective records are given in
- the following tables, and shown graphically in Figure 2.6, where white dots represent
- successful surgeries and black dots represent failed surgeries.
- 
- >Dr. Good had a higher success rate than Dr. Bad in heart surgeries: 70 out of 90
- versus 2 out of 10. Dr. Good also had a higher success rate in Band-Aid removal:
- 10 out of 10 versus 81 out of 90. But if we aggregate across the two types of surgeries
- to compare overall surgery success rates, Dr. Good was successful in 80 out of
- 100 surgeries while Dr. Bad was successful in 83 out of 100 surgeries: Dr. Bad's
- overall success rate is higher!
- 
>FIGURE 2.6- An example of Simpson's paradox. White dots represent successful surgeries and
- black dots represent failed surgeries. Dr. Good is better in both types of surgery
- but has a lower overall success rate, because he is performing the harder type of
- surgery much more often than Dr. Bad is.
- >
- >What's happening is that Dr. Good, presumably due to his reputation as the
- superior doctor, is performing a greater number of cardiac surgeries, which are inherently
- riskier than Band-Aid removals. His overall success rate is lower not because
- of lesser skill on any particular type of surgery, but because a larger fraction of his
- surgeries are risky.
- >
- >Let's use event notation to make this precise. For events A, B, and C, we say that
- we have a Simpson's paradox if
- >$\begin{align}
- P(A|B,C) & < P(A|B^C,C) \\
- $P(A|B,C^cC & < P(A|B^C, C^C)$; \\
- but $P(A|B) & > P(A|B^C)
- \end{align}$.
?In this case, let A be the event of a successful surgery, B be the event that Dr. Bad- is the surgeon, and C be the event that the surgery is a cardiac surgery. The conditions
- for Simpson's paradox are ful filled because the probability of a successful surgery
- is lower under Dr. Bad than under Dr. Good whether we condition on heart
- surgery or on Band-Aid removal, but the overall probability of success is higher for
- Dr. Bad.
- 
- If $a,b,c,d \ge 0$, $a < b, c< d$, then [$0 \le ab < cd$](https://math.stackexchange.com/q/3632752).
- The first snag is that the blue and orange inequalities are in the opposite direction as $P(A|B) > P(A|B^C)$! I can multiply them together, but their product is also in the opposite direction.
- Snag #2 is the purple inequality underlined in purple, because it's in the opposite direction too! So I can't simply multiple the purple inequality by the green inequality!
- I've modified this example to make it easier to understand.
- >### Example 2.8.3 (Simpson's paradox).
- >Two doctors, Dr. Good and Dr. Bad, each
- perform two types of surgeries: cardiac surgery and Band-Aid removal. Each surgery
- can be either a success or a failure. The two doctors' respective records are given in
- the following tables, and shown graphically in Figure 2.6, where white dots represent
- successful surgeries and black dots represent failed surgeries.
- 
- >Dr. Good had a higher success rate than Dr. Bad in heart surgeries: 70 out of 90
- versus 2 out of 10. Dr. Good also had a higher success rate in Band-Aid removal:
- 10 out of 10 versus 81 out of 90. But if we aggregate across the two types of surgeries
- to compare overall surgery success rates, Dr. Good was successful in 80 out of
- 100 surgeries while Dr. Bad was successful in 83 out of 100 surgeries: Dr. Bad's
- overall success rate is higher!
- 
- >**FIGURE 2.6**
- An example of Simpson's paradox. White dots represent successful surgeries and
- black dots represent failed surgeries. Dr. Good is better in both types of surgery
- but has a lower overall success rate, because he is performing the harder type of
- surgery much more often than Dr. Bad is.
- >
- >What's happening is that Dr. Good, presumably due to his reputation as the
- superior doctor, is performing a greater number of cardiac surgeries, which are inherently
- riskier than Band-Aid removals. His overall success rate is lower not because
- of lesser skill on any particular type of surgery, but because a larger fraction of his
- surgeries are risky.
- >
- >Let's use event notation to make this precise. For events A, B, and C, we say that
- we have a Simpson's paradox if
- >
- >$\begin{align}
- P(A|B,C) & < P(A|B^C,C) \\
- $P(A|B,C^cC & < P(A|B^C, C^C)$; \\
- but $P(A|B) & > P(A|B^C)
- \end{align}$.
- >
- >In this case, let A be the event of a successful surgery, B be the event that Dr. Bad
- is the surgeon, and C be the event that the surgery is a cardiac surgery. The conditions
- for Simpson's paradox are ful filled because the probability of a successful surgery
- is lower under Dr. Bad than under Dr. Good whether we condition on heart
- surgery or on Band-Aid removal, but the overall probability of success is higher for
- Dr. Bad.
- 
- Blitzstein. *Introduction to Probability* (2019 2 ed). pp 76-78.
#1: Initial revision
by
DNB
·
2021-08-14T08:22:59Z (almost 4 years ago)
How do I prove Simpson's Paradox, scilicet $P(A|B) > P(A|B^C)$?
I've modified this example to make it easier to understand.
>### Example 2.8.3 (Simpson's paradox).
>Two doctors, Dr. Good and Dr. Bad, each
perform two types of surgeries: cardiac surgery and Band-Aid removal. Each surgery
can be either a success or a failure. The two doctors' respective records are given in
the following tables, and shown graphically in Figure 2.6, where white dots represent
successful surgeries and black dots represent failed surgeries.

>Dr. Good had a higher success rate than Dr. Bad in heart surgeries: 70 out of 90
versus 2 out of 10. Dr. Good also had a higher success rate in Band-Aid removal:
10 out of 10 versus 81 out of 90. But if we aggregate across the two types of surgeries
to compare overall surgery success rates, Dr. Good was successful in 80 out of
100 surgeries while Dr. Bad was successful in 83 out of 100 surgeries: Dr. Bad's
overall success rate is higher!

>FIGURE 2.6
An example of Simpson's paradox. White dots represent successful surgeries and
black dots represent failed surgeries. Dr. Good is better in both types of surgery
but has a lower overall success rate, because he is performing the harder type of
surgery much more often than Dr. Bad is.
>
>What's happening is that Dr. Good, presumably due to his reputation as the
superior doctor, is performing a greater number of cardiac surgeries, which are inherently
riskier than Band-Aid removals. His overall success rate is lower not because
of lesser skill on any particular type of surgery, but because a larger fraction of his
surgeries are risky.
>
>Let's use event notation to make this precise. For events A, B, and C, we say that
we have a Simpson's paradox if
>$\begin{align}
P(A|B,C) & < P(A|B^C,C) \\
$P(A|B,C^cC & < P(A|B^C, C^C)$; \\
but $P(A|B) & > P(A|B^C)
\end{align}$.
?In this case, let A be the event of a successful surgery, B be the event that Dr. Bad
is the surgeon, and C be the event that the surgery is a cardiac surgery. The conditions
for Simpson's paradox are ful
filled because the probability of a successful surgery
is lower under Dr. Bad than under Dr. Good whether we condition on heart
surgery or on Band-Aid removal, but the overall probability of success is higher for
Dr. Bad.
