Communities

Writing
Writing
Codidact Meta
Codidact Meta
The Great Outdoors
The Great Outdoors
Photography & Video
Photography & Video
Scientific Speculation
Cooking
Cooking
Electrical Engineering
Judaism
Judaism
Languages & Linguistics
Software Development
Mathematics
Mathematics
Christianity
Christianity
Code Golf
Code Golf
Music
Music
Physics
Physics
Linux Systems
Linux Systems
Power Users
Power Users
Tabletop RPGs
Tabletop RPGs
Community Proposals
Community Proposals
tag:snake search within a tag
answers:0 unanswered questions
user:xxxx search by author id
score:0.5 posts with 0.5+ score
"snake oil" exact phrase
votes:4 posts with 4+ votes
created:<1w created < 1 week ago
post_type:xxxx type of post
Search help
Notifications
Mark all as read See all your notifications »
Q&A

Post History

#1: Initial revision by user avatar thelast19digitsofpi‭ · 2021-06-05T15:38:14Z (almost 3 years ago)
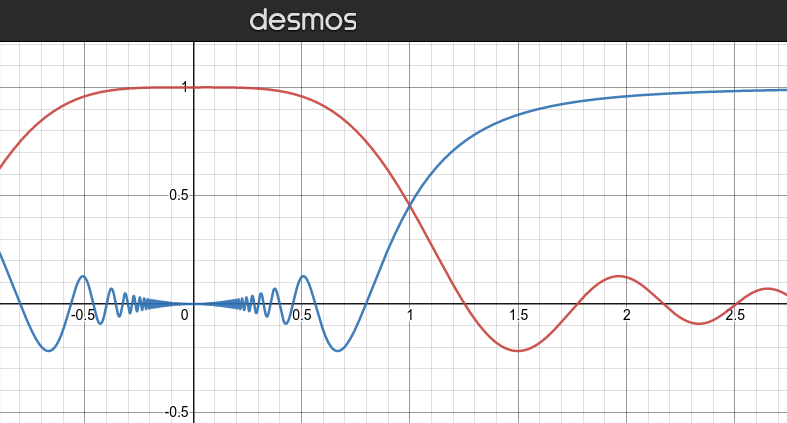
I'm not sure if it's really possible to visualize it without creating another graph, but what you could do is take a function, like f(x) = sin(2x²)/2x², and graph f(x) and f(1/x) on the same graph. Notice how the peaks and valleys of the red function, f(x), and the blue function, f(1/x), correspond to each other.

![Graphs of f(x) = sin(2x^2)/2x^2 and also f(1/x), made with Desmos](https://math.codidact.com/uploads/DBEMp21qX7WEXc9nxxH9gKxP)

You could do that double plot with g(x) = <math>(1+x)^{1/x}</math>, although the graph would be more boring and it would be harder to see what is going on.

(If the g(x) expression says "Math input error", then it's supposed to read (1+x)<sup>1/x</sup>.)