No, you likely won't get there from where you are. (But see below.)
When you write that your (point) forecasts are "good enough to forecast actual sales values", they are likely aiming at central tendencies, like expected future sales, or median future sales, or the (-1)-median of future sales.
(If you don't understand what I mean by the previous paragraph, then you might find ["What are the shortcomings of the Mean Absolute Percentage Error (MAPE)?"](https://stats.stackexchange.com/q/299712/1352) or [Kolassa, 2020, *IJF*](https://doi.org/10.1016/j.ijforecast.2019.02.017) enlightening.)
However, the central tendency has very little to do with the *maximum* of a probability distribution. Two time series might have the same central tendency, but very different variability (variance). Then the series with the higher variability will have a higher maximum.
As an example, here are two simulated series with the same expectation of 10, but very different variances:
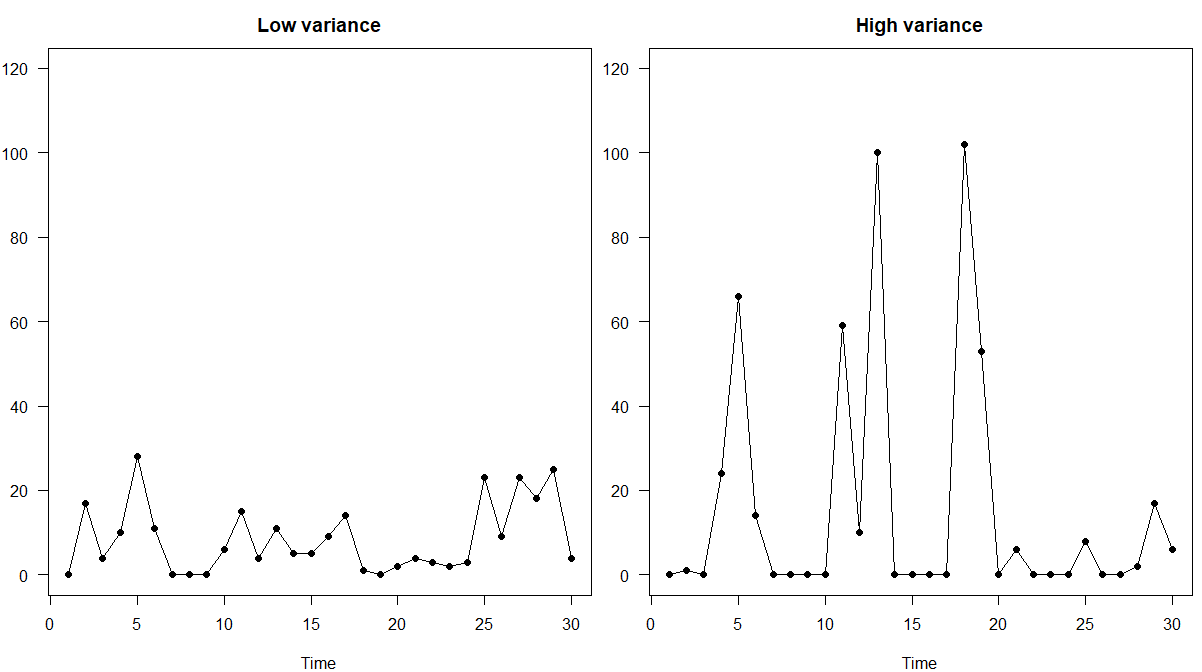
Thus, what you need in addition to your central tendency forecast is either a forecast of future variance plus a distributional assupmtion (e.g., that future sales will be normally or negative binomial distributed with your central tendency and variance forecasts as parameters), from which you can derive predictions for maximum sales over some time.
Alternatively, you can try to forecast the maximum over a certain period directly, but that is *hard*. [Order statistics](https://en.wikipedia.org/wiki/Order_statistic) are hard to elicit. If at all, you might want to directly forecast a high quantile of sales, like the 95% or 98% quantile. That is usually enough in sales forecasting, because stocking enough product to cover *all* future sales (which is what a maximum forecast aims at) will usually require unacceptably high safety stocks.
And this is why I said to "see below". Because depending on your loss function (which would not be the wMAPE, though, but a pinball loss; see [Gneiting, 2011, *IJF*](https://doi.org/10.1016/j.ijforecast.2009.12.015)), you can have direct point forecasts that are quantile forecasts for your target quantile - and if you are aiming at, say, a 95% quantile and your point forecast exceeds precisely 95% of sales, then this is certainly again "good enough to forecast actual sales values", as you write. It's just that "good enough" needs to be made a little more precise.
R code for the plot:
nn <- 30
mu <- 10
size <- c(1,0.2)
set.seed(2) # for reproducibility
par(mfrow=c(1,2),mai=c(.8,.5,.5,.1),las=1)
plot(rnbinom(nn,mu=mu,size=size[1]),type="o",pch=19,
xlab="Time",ylab="",main="Low variance",ylim=c(0,120))
plot(rnbinom(nn,mu=mu,size=size[2]),type="o",pch=19,
xlab="Time",ylab="",main="High variance",ylim=c(0,120))
 Stephan Kolassa
·
2020-10-18T07:06:15Z (over 4 years ago)
Stephan Kolassa
·
2020-10-18T07:06:15Z (over 4 years ago)