Post History
#4: Post edited
- Discrete data can also be visualized by histograms.
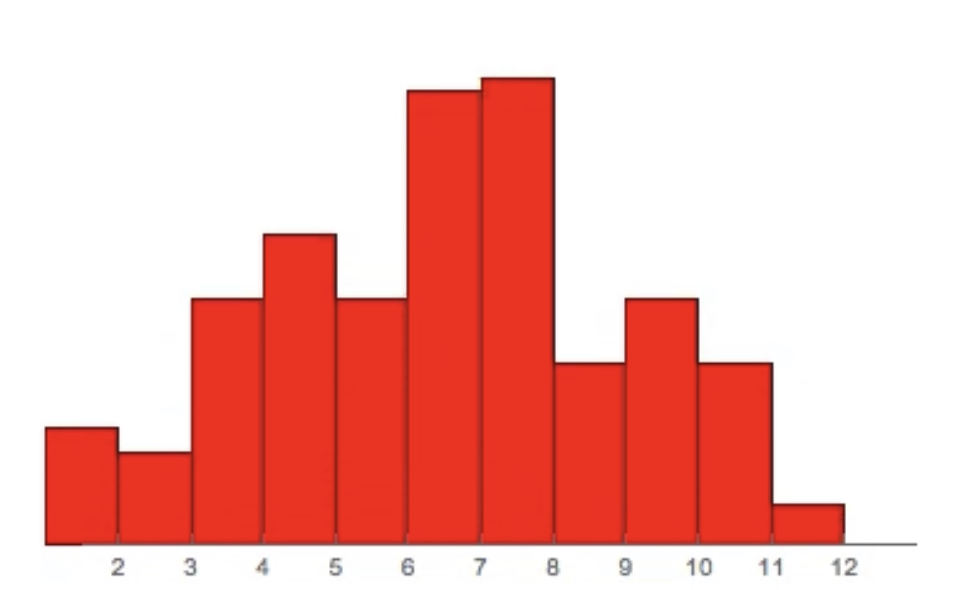
- Here is a trivial example of histogram visualizing 200 rolls of 2 fair 6-sided dices using [WolframAlpha](https://demonstrations.wolfram.com/TwoDiceWithHistogram/):
- 
- Outcome of a roll of two dices can only be some discrete number between 2-12. Yet as the picture above shows we can easily visualize the distribution of our randomly generated discrete dice throws.
- You can also use this histogram to visually detect skewness pretty much the same way as you would for continuous data.
However, even though visual detection of skewness is encouraged in undergraduate statistics courses you should not that it is note very rigorous way of detecting it.
- Discrete data can also be visualized by histograms.
- Here is a trivial example of histogram visualizing 200 rolls of 2 fair 6-sided dices using [WolframAlpha](https://demonstrations.wolfram.com/TwoDiceWithHistogram/):
- 
- Outcome of a roll of two dices can only be some discrete number between 2-12. Yet as the picture above shows we can easily visualize the distribution of our randomly generated discrete dice throws.
- You can also use this histogram to visually detect skewness pretty much the same way as you would for continuous data.
- However, even though visual detection of skewness is encouraged in undergraduate statistics courses you should note that it is not very rigorous way of detecting it.
#3: Post edited
- Discrete data can also be visualized by histograms.
- Here is a trivial example of histogram visualizing 200 rolls of 2 fair 6-sided dices using [WolframAlpha](https://demonstrations.wolfram.com/TwoDiceWithHistogram/):
- 
- Outcome of a roll of two dices can only be some discrete number between 2-12. Yet as the picture above shows we can easily visualize the distribution of our randomly generated discrete dice throws.
- You can also use this histogram to visually detect skewness pretty much the same way as you would for continuous data.
However, even though visual detection of skewness is encouraged in undergraduate statistics courses you should not that it is not very rigorous way of detecting it.
- Discrete data can also be visualized by histograms.
- Here is a trivial example of histogram visualizing 200 rolls of 2 fair 6-sided dices using [WolframAlpha](https://demonstrations.wolfram.com/TwoDiceWithHistogram/):
- 
- Outcome of a roll of two dices can only be some discrete number between 2-12. Yet as the picture above shows we can easily visualize the distribution of our randomly generated discrete dice throws.
- You can also use this histogram to visually detect skewness pretty much the same way as you would for continuous data.
- However, even though visual detection of skewness is encouraged in undergraduate statistics courses you should not that it is note very rigorous way of detecting it.
#2: Post edited
- Discrete data can also be visualized by histograms.
- Here is a trivial example of histogram visualizing 200 rolls of 2 fair 6-sided dices using [WolframAlpha](https://demonstrations.wolfram.com/TwoDiceWithHistogram/):
- 
- Outcome of a roll of two dices can only be some discrete number between 2-12. Yet as the picture above shows we can easily visualize the distribution of our randomly generated discrete dice throws.
You can also use this histogram to visually detect skewness pretty much the same way as you would for continuous data.
- Discrete data can also be visualized by histograms.
- Here is a trivial example of histogram visualizing 200 rolls of 2 fair 6-sided dices using [WolframAlpha](https://demonstrations.wolfram.com/TwoDiceWithHistogram/):
- 
- Outcome of a roll of two dices can only be some discrete number between 2-12. Yet as the picture above shows we can easily visualize the distribution of our randomly generated discrete dice throws.
- You can also use this histogram to visually detect skewness pretty much the same way as you would for continuous data.
- However, even though visual detection of skewness is encouraged in undergraduate statistics courses you should not that it is not very rigorous way of detecting it.
#1: Initial revision
Discrete data can also be visualized by histograms. Here is a trivial example of histogram visualizing 200 rolls of 2 fair 6-sided dices using [WolframAlpha](https://demonstrations.wolfram.com/TwoDiceWithHistogram/):  Outcome of a roll of two dices can only be some discrete number between 2-12. Yet as the picture above shows we can easily visualize the distribution of our randomly generated discrete dice throws. You can also use this histogram to visually detect skewness pretty much the same way as you would for continuous data.


