Communities

Writing
Writing
Codidact Meta
Codidact Meta
The Great Outdoors
The Great Outdoors
Photography & Video
Photography & Video
Scientific Speculation
Cooking
Cooking
Electrical Engineering
Judaism
Judaism
Languages & Linguistics
Software Development
Mathematics
Mathematics
Christianity
Christianity
Code Golf
Code Golf
Music
Music
Physics
Physics
Linux Systems
Linux Systems
Power Users
Power Users
Tabletop RPGs
Tabletop RPGs
Community Proposals
Community Proposals
tag:snake search within a tag
answers:0 unanswered questions
user:xxxx search by author id
score:0.5 posts with 0.5+ score
"snake oil" exact phrase
votes:4 posts with 4+ votes
created:<1w created < 1 week ago
post_type:xxxx type of post
Search help
Notifications
Mark all as read See all your notifications »
« Back to help center

Answer scoring and ordering

Overview

On Codidact, answers to questions are sorted by their scores, so that you'll see the best-received answers first. Each answer has a score based on a ratio of upvotes to total votes, weighted to favor posts with fewer downvotes. For example, a post with seven upvotes will be shown higher than a post with nine upvotes and two downvotes. This method gives a slight boost to contributions that are consistently viewed positively over more controversial answers that gather both upvotes and downvotes.

Calculations Used

The actual score of a particular post is calculated as

(upvote_count + z^2/2)/(upvote_count + downvote_count + z^2)

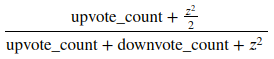
This uses a modified form of a Wilson Score, assuming a binomial distribution. By default the weighting constant z is two, but each community can change this to another value as they see fit. Several charts and graphs showing the default weighting distribution are shown below.

table of scores with the values for all upvote and downvote combinations from one to ten lines in a cartesian coordinate plane sloping from upper left to lower right and converging as z increases

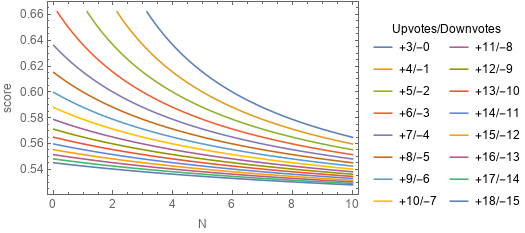
Diagram showing the distribution in scores where upvotes less downvotes = 3 for different values of z

a 3D diagram showing the score distribution for upvotes and downvotes

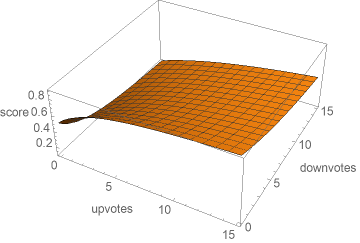
This table shows the scores for each combination of upvotes and downvotes where z = 2.